AI in forex trading is no longer a futuristic concept reserved for quantitative hedge funds. It is an active, evolving reality shaping how the $7.5 trillion-per-day currency markets operate. In 2026, the question for traders is no longer if they should pay attention to AI in forextrading but how to understand and leverage its power.
Artificial intelligence is becoming a decision engine for finance, moving beyond simple automation to tackle judgment-heavy work where it has the most leverage. This shift is creating a clear “Decision Advantage” for those who master it—whether they are global banks or retail traders. This comprehensive guide will cut through the hype and provide a clear, professional analysis of how AI in forex trading is reshaping the market, the tools available, and what it means for traders in 2026. Understanding AI in forex trading is no longer optional; it is becoming a competitive necessity.
AI is fundamentally reshaping how forex markets operate in 2026
The Evolution of AI in Forex Trading
The integration of AI in forex trading has accelerated dramatically over the past few years. Active AI use in the finance function has more than doubled in just two years. While 71% of organizations report AI is meeting or exceeding ROI expectations, only 23% say it is exceeding them, indicating that success is not just about adoption but about strategic application. This means that simply using AI in forex trading tools is not enough—traders must understand how to deploy them effectively.
Key Drivers of AI Adoption in Forex
Driver
Description
Impact on AI in forex trading
Data Complexity
Increasing volume and velocity of market data
AI excels at analyzing vast datasets to identify patterns that humans cannot see
Execution Latency
Institutional algorithms generate >70% of daily FX volume
Retail traders use AI to compensate for a latency disadvantage of AI in forex trading
Judgment-Intensive Work
AI produces its strongest gains in forecasting, risk assessment, and strategic planning
Moves AI from a cost-saving tool to a strategic asset in AI in forex trading
Agentic AI
Systems that can plan, execute, and adapt with minimal human oversight
Reshapes workflows from passive assistance to active agency in AI in forex trading
The transition from traditional rule-based algorithms to AI-driven systems represents a fundamental shift in AI in forex trading. Traditional algorithms follow predefined rules. AI systems, however, learn from data, adapt to changing market conditions, and continuously improve their performance. This is the key differentiator that makes AI in forex trading so powerful.
The Rise of Agentic AI in Finance
The next phase of AI in forex trading is the rise of “agentic AI.” Unlike traditional AI, which reacts to inputs, agentic AI autonomously determines actions, plans multi-step workflows, and adapts in real-time. Moody’s analysis shows early adoption of such systems has cut task completion times by 30% while shifting over 90% of AI interactions toward high-value analytics. This is a structural transformation in financial workflows, enabling better anticipation of liquidity risks and market shocks.
For traders exploring AI in forex trading, this means AI is moving beyond simple signal generation. It is becoming capable of managing entire trading strategies, adjusting risk parameters, and executing trades without human intervention. This is the future of AI in forex trading, and it is arriving faster than many expected.
Agentic AI systems are transforming trading workflows from passive analysis to active execution
How Institutions Are Using AI
Major financial institutions are deploying advanced AI in forex trading systems to gain a competitive edge. These real-world examples demonstrate the power of AI in action and provide valuable lessons for retail traders interested in AI in forex trading.
HSBC AI Markets
HSBC’s AI Markets platform combines proprietary FX data, analytics, and execution in a single interface. This is a prime example of how AI in forex trading is being integrated at the institutional level. Key features include the following:
NLP-Powered Chatbot: Clients access HSBC’s proprietary trading insights via natural language
Chat-2-Trade Function: Allows instant movement from analysis to execution
Liquidity Dashboards: Highlight intraday market volumes to reduce transaction costs
Event-Weighting Tools: Capture HSBC traders’ views on expected market volatility
🔵 Blue Highlight: HSBC built its own NLP and machine learning engines rather than relying on third parties, giving them greater control over security and evolution. This approach to AI in forex trading ensures that the technology is tailored to their specific needs.
ING’s AI-Powered Algo
ING has deployed AI-powered trading capabilities that strip away human intervention entirely, achieving remarkable results. The AI algorithm learns and adjusts spreads dynamically every hour to maximize client flow while managing risk. This is a powerful demonstration of AI in forex trading in action.
Result: FX flows increased substantially, client satisfaction improved, and ING’s profitability increased due to optimized spreads, even in volatile markets.
Key Insight: In highly volatile markets, AI doesn’t panic. This dispassionate, data-driven approach is proving to be more effective than human judgment in certain execution scenarios. This is why AI in forex trading is gaining traction so quickly.
Dukascopy’s AI-Powered Trading via MCP
Dukascopy has become one of the first Swiss banks to enable clients to connect AI assistants like ChatGPT and Claude directly to their trading accounts. Powered by the Model Context Protocol (MCP), traders can now:
Execute trades using natural language
Analyze instruments and manage positions
Calculate stop-loss and take-profit levels
Check account exposure
This integration works without complex menu navigation or programming knowledge, making AI in forex trading accessible to a wider audience. This democratization of AI in forex trading is a significant development for retail traders.
AI Trading Bots: Do They Actually Work for Retail Traders?
The market is flooded with AI trading bots promising passive income. However, the profitability reality for retail traders is more nuanced. Many traders exploring AI in forex trading are drawn to these bots, but the results are often disappointing.
The Profitability Reality
Industry standards suggest that fewer than 20% of retail algorithmic systems generate consistent positive returns across three or more years of live trading. However, this does not indict automation—it indicts poorly validated automation. The key to successful AI in forex trading is not the bot itself but the validation process behind it.
🔴 Red Highlight: Vendor-marketed black-box systems often generate consistent profits for their sellers (through subscriptions), not for their buyers. Prop traders who build and validate their own systems demonstrate measurable edge. This is a critical distinction in AI in forex trading.
3 Pillars of Algorithmic Profitability
Pillar
Description
Why It Matters for AI in Forex Trading
Validated Edge
Strategy must show statistically significant positive expectancy across 500+ backtested trades with out-of-sample confirmation
Avoids curve-fitting and false confidence in AI in forex trading
Dynamic Optimization
Prop traders run monthly/quarterly parameter reviews to prevent strategy decay as market regimes shift
Adapts to changing market conditions in AI in forex trading
Capital Efficiency
Algorithmic execution on a funded account amplifies a proven edge across institutional-scale capital without risking personal funds
Leverages a strong strategy safely in AI in forex trading
The Research-Backed Edge: Hybrid Systems
A 2026 study published in Expert Systems with Applications introduced the Hybrid Candlestick Trend Predictor (HCTP), a framework integrating a lightweight neural network for long-term trend forecasting with candlestick pattern recognition for short-term signals. This research is significant for anyone serious about AI in forex trading.
Results Across 3 Major Pairs (2019-2025): Achieved win rates of 73.6%–76.0% and profit factors of 1.29–3.22 under realistic transaction costs.
Significant Improvement: Represented an 8.7–10.7 percentage point improvement in win rate over standalone pattern recognition.
Key Trade-off: Enhanced selectivity came at the cost of increased maximum drawdown in some pairs (e.g., from 3.83% to 28.20% for EUR/USD).
🔵 Blue Highlight: This research confirms that AI-driven forex trading strategies can create a statistically significant edge, but they come with predictable risk trade-offs. Understanding these trade-offs is essential for successful AI in forex trading.
Understanding the gap between retail and institutional algorithmic trading
The Execution Gap: Retail vs Institutional
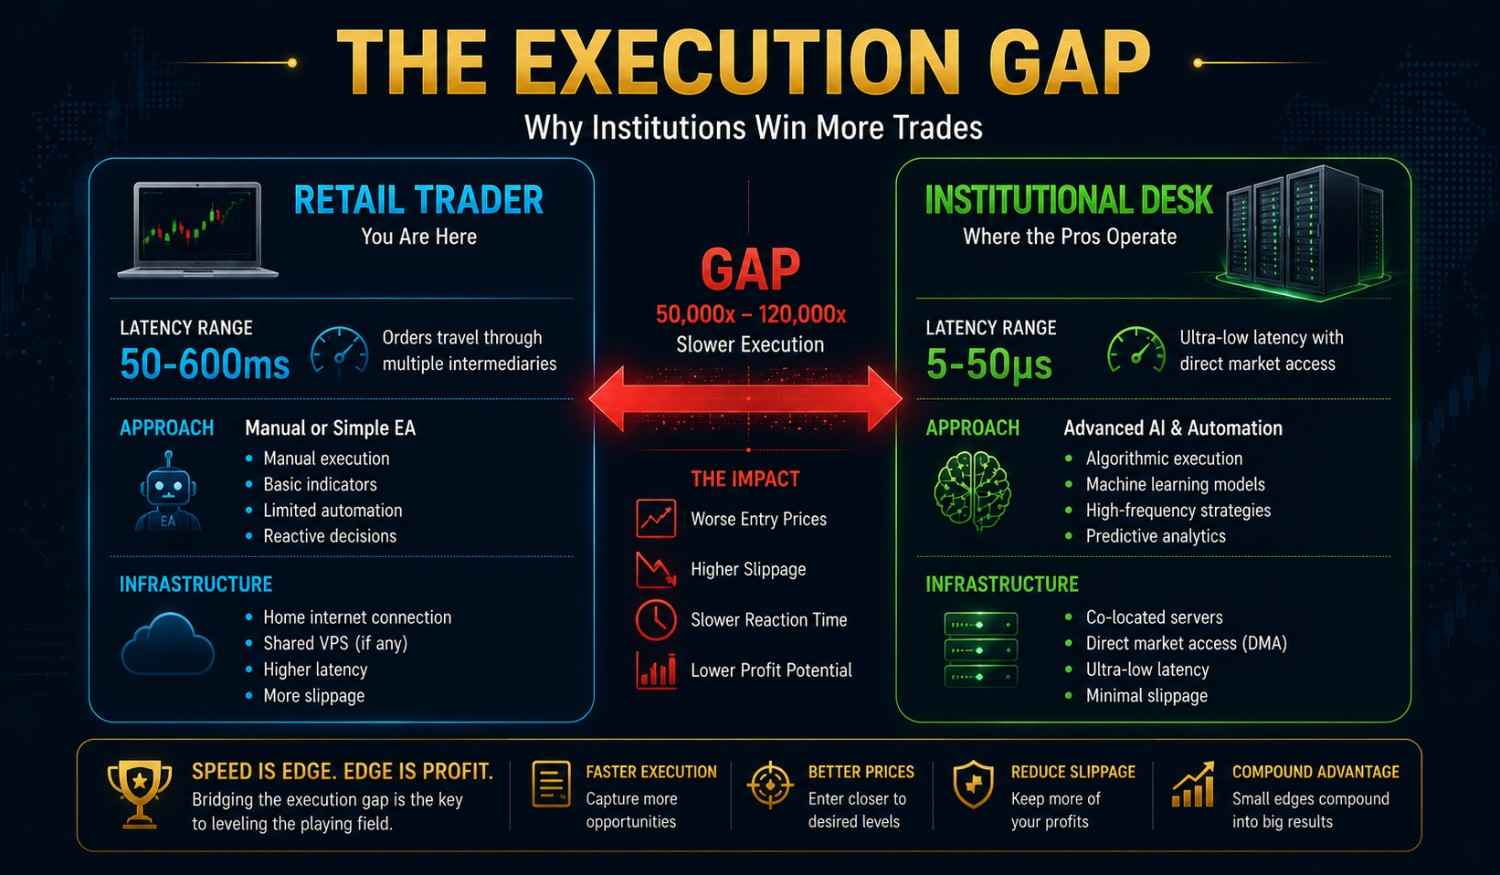
Institutional algorithms now generate more than 70% of daily FX volume, while retail traders often operate with a latency disadvantage measured in hundreds of milliseconds. This is a significant challenge in AI in forex trading. However, retail traders can bridge this gap through a structured approach that leverages AI in forex trading tools effectively.
Feature
Institutional Standard
Retail Reality
AI Equalizer in AI in forex trading
Execution Latency
5–50 microseconds (co-located)
50–600 ms (VPS/manual)
VPS + EA reduces latency to ~50 ms
Market Data
Direct Level 2 tick feed
Broker-aggregated OHLCV
AI filters noise from broker feed
Order Routing
Smart routing across ECNs
Single-broker STP/NDD
The algorithm selects optimal timing
Risk Management
Automated real-time exposure limits
Manual position sizing
EA enforces a fixed risk per trade
Operating Hours
24/5 automated systems
Human fatigue limits coverage
Algo trades all sessions without rest
💡 Pro Tip: Retail traders can compete through discipline, not raw speed. An expert advisor (EA) running on a dedicated VPS eliminates human hesitation, fatigue, and emotional override. This is one of the most practical applications of AI in forex trading for retail traders.
How to Get Started with AI in Forex Trading
A practical, structured approach is essential for success in AI in forex trading. Based on industry best practices from technology providers, banks, and researchers, here is a clear, step-by-step guide:
Step 1: Evaluate Platform Options
The right software depends on your technical skills. Choose a platform compatible with your trading terminal (e.g., MetaTrader 4/5). This is the first practical step in AI in forex trading.
Platform Type
Learning Curve
Prop Firm Compatibility
Cost Structure
Visual drag-and-drop builder
Low — no coding required
High — MT4/MT5 EA export
Freemium to ~$50/month
Script-based (MQL4/MQL5)
Medium — basic coding
Native MT4/MT5 support
Free (broker-provided IDE)
Python + broker API
High — full dev knowledge
Varies by firm API policy
$0–$200/month (hosting)
Cloud strategy platforms
Low-medium — GUI + logic blocks
Moderate — API bridge required
$30–$150/month
Step 2: Build and Validate Your Strategy
Avoid the trap of over-optimization. Use a robust validation framework:
Use out-of-sample testing: Validate your strategy on data it has never seen.
Apply realistic costs: Factor in spreads and slippage during testing.
Focus on risk-adjusted returns: Profit factor and win rate are not the whole story.
Step 3: Start Small and Monitor
Use a demo account: Test your system in a risk-free environment.
Monitor drawdowns: Understand the maximum loss you are prepared to accept.
Keep human oversight: AI assists, but it does not replace responsibility.
The Future: AI’s Growing Role in Forex Trading
The trajectory is clear. AI in forex trading will continue to integrate deeper into the market infrastructure, with agentic AI systems capable of autonomously managing trading strategies and optimizing portfolios becoming more common.
From Analysis to Action: Banks like HSBC and Dukascopy are pioneering the “idea to execution” workflow where AI serves as a co-pilot for traders.
The Democratization of AI: Technology providers like oneZero are positioned to democratize access to AI models for all participants in the FX market.
Governance is Key: As AI takes on more autonomous roles, trust, operationalized through robust governance, will be the defining advantage.
Common Mistakes When Using AI in Forex Trading
Mistake
Why It’s a Problem
How to Fix
Over-optimization (Curve Fitting)
Strategy works only on historical data
Use out-of-sample and forward testing
Ignoring Market Regime Changes
AI models fail when conditions shift
Regularly retrain and adapt your models
No Human Oversight
AI can make errors in extreme conditions
Maintain a monitoring role
Trusting Vendor Claims
Many bots are designed to sell, not trade
Validate all claims with independent testing
Neglecting Risk Management
Even the best AI strategy needs risk controls
Apply the 1% rule and stop losses
Conclusion: Embrace the AI Shift, But Stay Grounded
AI in forex trading is not a myth—it is a powerful new reality. It offers the potential for analysis at scale and precise, emotion-free execution that can enhance trading performance for both institutions and retail traders. However, it is not a magic wand for effortless profits.
Success in the AI-driven era of forex will belong to those who:
Understand the tools and their limitations
Prioritize data quality and robust governance
Combine AI’s analytical power with human judgment and strategic oversight
Commit to continuous learning and adaptation
🎯 Final Thought: The edge in trading is no longer just about the strategy itself but about mastering the technology that enables superior decision-making. As the KPMG report highlights, trust and the operating discipline around AI are what separate the leaders. By embracing AI in forex trading strategically and responsibly, you can position yourself for success in the evolving currency markets.
FAQ
1. What is AI in forex trading?
AI in forex trading refers to using artificial intelligence to analyze market data, generate trading signals, and execute trades automatically or semi-automatically. It leverages machine learning to identify patterns that humans might miss.
2. Are AI trading bots profitable?
Profitability depends on the bot’s design and validation. Vendor bots often fail, while trader-built, well-tested systems have shown statistically significant positive expectancy.
3. Can retail traders compete with institutional AI?
Yes, by using discipline and AI tools to eliminate human error. While they can’t match speed, they can achieve consistent, rule-based execution through expert advisors.
4. What is a hybrid AI trading strategy?
A hybrid strategy combines different AI techniques, like using a neural network for long-term trend forecasting and candlestick pattern recognition for short-term signals, as validated by recent research.
5. Is it legal to use AI bots in forex trading?
Yes, using AI-powered trading bots and algorithms is legal and widely accepted, with many prop firms even permitting their use under specific conditions.
6. Do I need coding skills to use AI in forex trading?
Not necessarily. No-code algorithmic trading software platforms allow traders to build, test, and deploy expert advisors without writing code. However, understanding the logic behind your strategy is crucial.
Further Reading
To deepen your understanding of forex trading and related strategies, explore these additional resources from Finwirestack:
Disclaimer: Trading forex and CFDs involves significant risk of loss. It is not suitable for all investors. You should carefully consider your investment objectives, level of experience, and risk appetite before trading. Never trade with money you cannot afford to lose. The information provided in this article is for educational purposes only and does not constitute financial advice.
How to read forex charts is one of the first skills every aspiring trader must master. Without this ability, you are essentially trading blind—relying on intuition rather than data and emotion rather than analysis.
But here is the good news: learning how to read forex charts is not as complicated as it seems. Once you understand the basic building blocks—candlesticks, timeframes, support and resistance, and a few key patterns—you will be able to look at any chart and quickly assess what the market is telling you.
This comprehensive guide will teach you how to read forex charts from the ground up. You will learn:
The different types of forex charts and when to use each
How to read candlestick charts like a professional
How to identify trends, support, and resistance
Five essential candlestick patterns every beginner must know
How to apply these skills with real-world examples
A practical chart-reading checklist for every trade
By the end, you will have the confidence to look at any forex chart and understand the story it is telling.
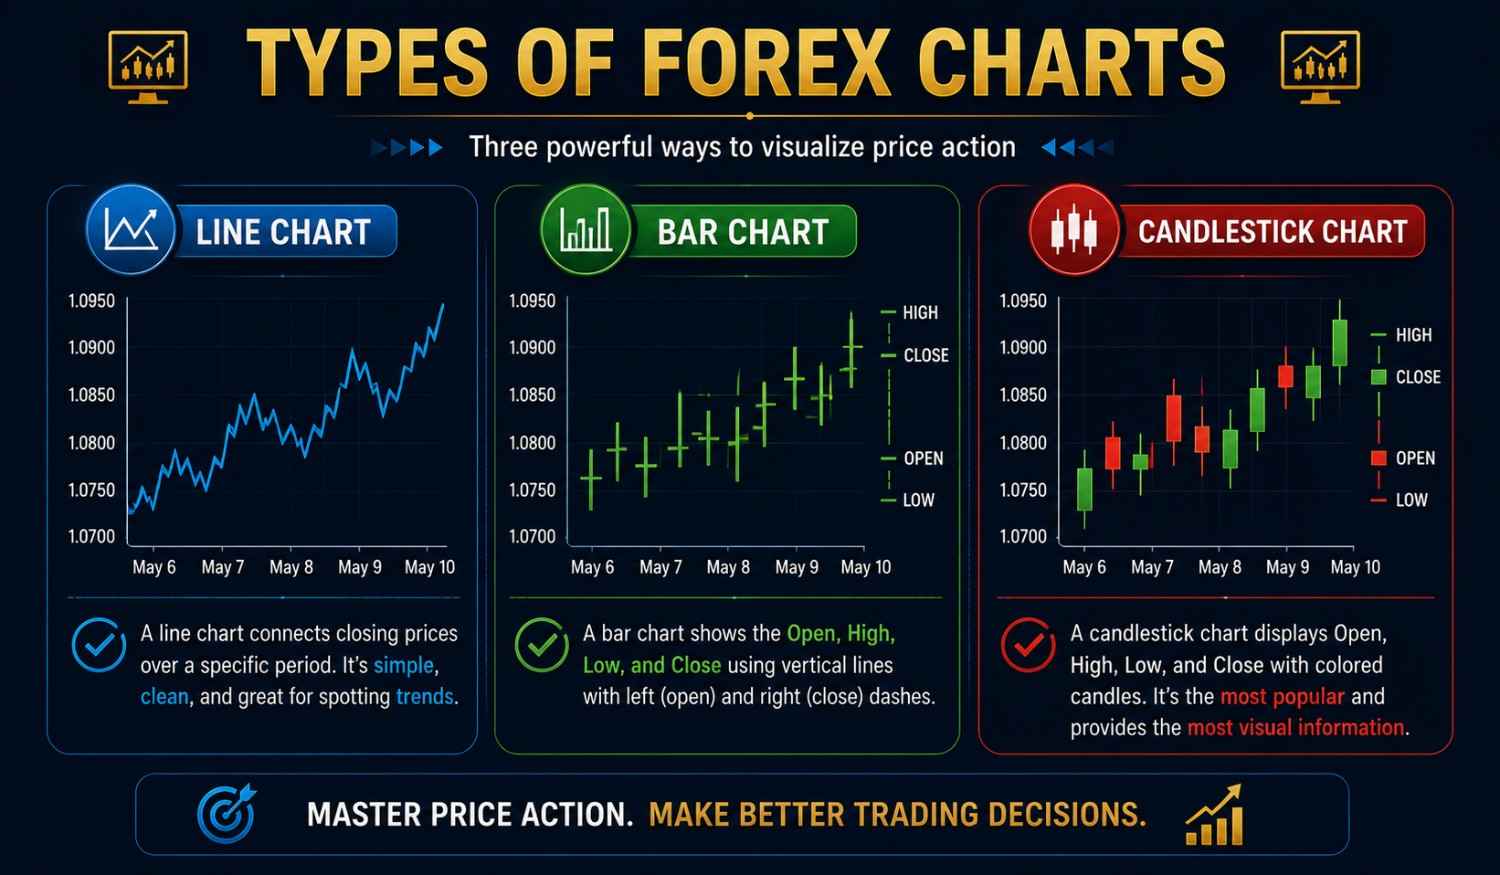
The three main types of forex charts are line, bar, and candlestick
What is a Forex Chart?
A forex chart is a visual representation of the price movements of a currency pair over a specific period of time. It shows how the exchange rate has changed, allowing traders to analyze trends, identify patterns, and make informed decisions about when to buy or sell.
Any chart will always display two things on its axes:
Time is on the horizontal x-axis
Price is on the vertical y-axis
In this way, a chart shows how a market’s price has changed over time. You can choose how much time to show on your chart—from one minute to one month or even one year.
The 5 Main Types of Forex Charts
When learning how to read forex charts, you will encounter several different chart types. Each offers a different level of detail and serves a different purpose.
1. Line Charts (Mountain Charts)
A line chart connects a set of single exchange rate observations with a straight line. These charts most often use closing prices, although they could be drawn through high, low, or opening prices instead.
When to Use: Line charts offer a simplified picture of exchange rate movements, making them excellent for identifying overall trends and large-scale patterns. They help you de-noise the chart and see the primary drift quickly.
🎯 Real-World Example: If you want to see whether EUR/USD has been generally rising or falling over the past six months, a line chart gives you that answer in three seconds. You don’t need the noise of every intraday fluctuation.
2. Bar Charts (OHLC or HLOC Charts)
Bar charts show the high, low, open, and close (OHLC) for each time period. Each bar is formed by:
A vertical line connecting the high and low
A small horizontal dash protruding to the left shows the open price
A small horizontal dash protruding to the right shows the close price
When to Use: Bar charts provide more information than line charts while maintaining a clean appearance. They are particularly useful for identifying exchange rate gaps and seeing whether the market has closed above a key level.
3. Candlestick Charts
Candlestick charts are a Japanese invention that offers even more information than a bar chart because the color of the candle’s body immediately tells you whether the market rose or fell during the period. This is the most popular chart type for traders learning how to read forex charts.
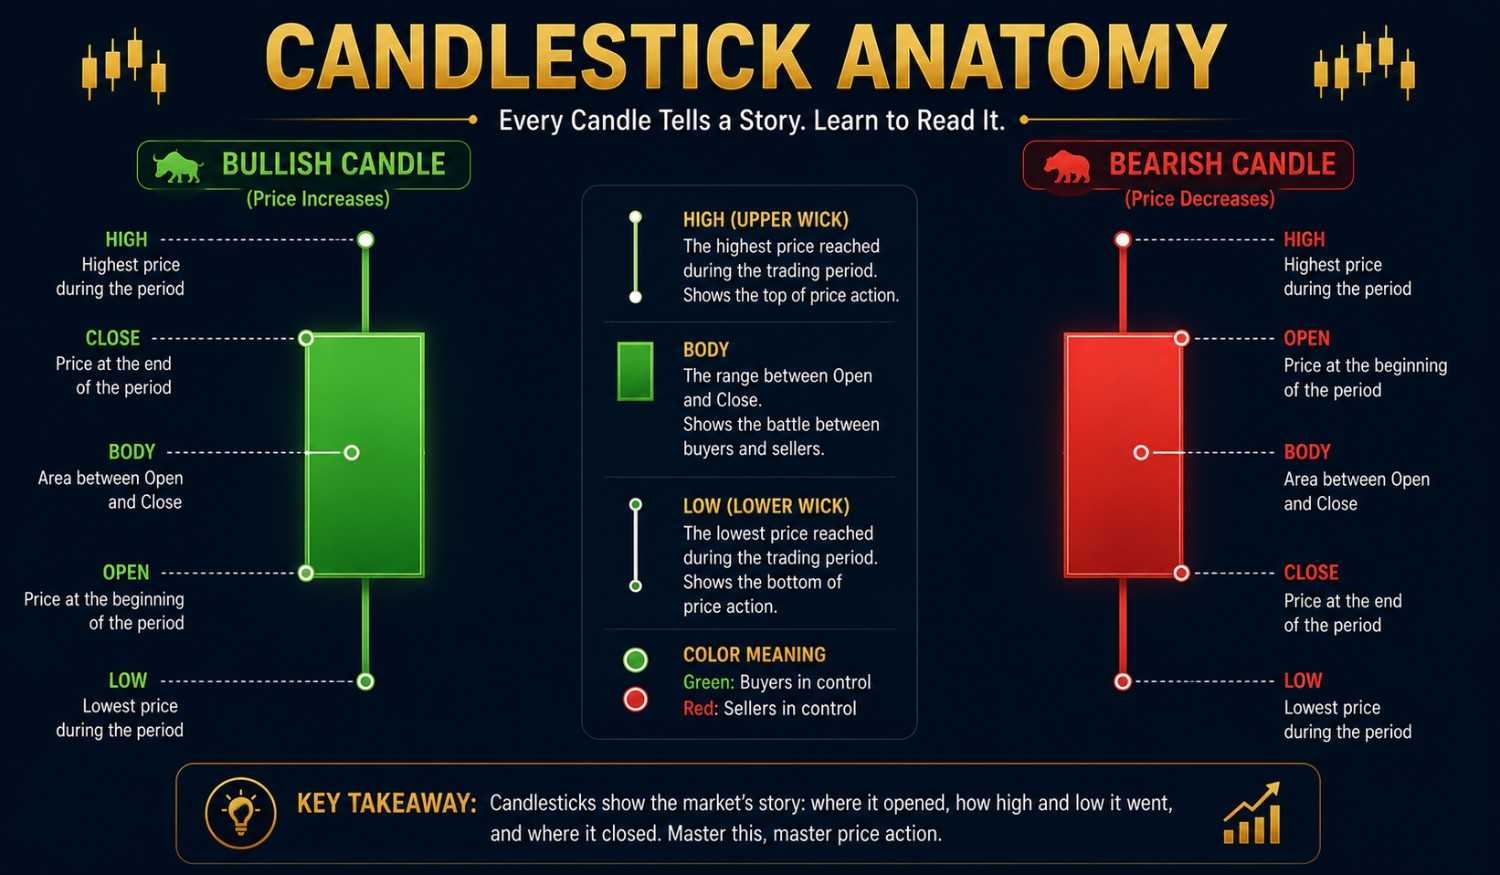
Anatomy of a Candlestick:
Body: The rectangular area between the open and close prices
Upper Wick: The line from the top of the body to the highest price
Lower Wick: The line from the bottom of the body to the lowest price
Color: Green (or white) for bullish candles (close > open), red (or black) for bearish candles (close < open)
The anatomy of a candlestick—understanding open, high, low, and close when learning how to read forex charts.
How to Read a Candlestick
Understanding how to read forex charts means understanding what each candlestick tells you. A single candlestick reveals four critical pieces of information:
Element
What It Tells You
Open
The price at the start of the period
High
The highest price reached during the period
Low
The lowest price reached during the period
Close
The price at the end of the period
Color
Whether buyers (green) or sellers (red) controlled the period
What Different Candlesticks Mean
Candle Type
What It Looks Like
What It Tells You
Long Green Body
Tall green rectangle
Strong buying pressure—buyers were in control throughout the period
Long Red Body
Tall red rectangle
Strong selling pressure—sellers were in control
Small Body (Green or Red)
Short rectangle
Indecision—neither buyers nor sellers dominated
Long Upper Wick
Long line above small body
The price rallied but was pushed back down—sellers stepped in
Long Lower Wick
Long line below small body
The price fell but was pushed back up—buyers stepped in
Doji
Open ≈ Close (cross shape)
Complete indecision—the market is undecided
Understanding Timeframes
Timeframes are a crucial part of how to read forex charts. The timeframe determines how often a new candle or bar is printed on your chart.
Common Timeframes
Timeframe
Type
Best Used For
M1, M5, M15
Short-term
Day trading, scalping
H1, H4
Medium-term
Swing trading, beginner-friendly
Daily, Weekly
Long-term
Position trading, identifying major trends
Monthly
Very Long-term
Understanding multi-year trends
The Top-Down Approach
Professional traders use a top-down approach when analyzing charts:
Map trends and key levels on the Daily or Weekly chart (the “big picture”)
Refine your analysis on the H4 or H1 chart (the “medium picture”)
Execute your trade on the H1 or M15 chart (the “entry” picture)
🎯 Real-World Example: You want to trade EUR/USD.
Weekly Chart: You see EUR/USD is in a strong uptrend (higher highs and higher lows)
H4 Chart: You see price is pulling back to a support level near 1.1000
H1 Chart: You spot a bullish candlestick pattern confirming the support hold
Entry: You buy EUR/USD at 1.1005 with a stop-loss below the recent swing low
Using multiple timeframes to identify trends and find the best entry points when learning how to read forex charts
Support and Resistance: The Foundation of Chart Reading
Support and resistance are the foundation of technical analysis. They are so important that even traders who focus on fundamentals use them for entry and exit points.
What Are Support and Resistance?
Level
Definition
Analogy
Support
A price level where buying pressure is strong enough to prevent further declines
A “floor” that prices bounce off
Resistance
A price level where selling pressure is strong enough to prevent further rises
A “ceiling” that prices bounce off
When learning how to read forex charts, support and resistance levels reflect past market behavior, influencing future price action based on trader psychology. At support levels, previous buying interest suggests a potential buying opportunity. Conversely, resistance levels might trigger selling from traders who recall prior struggles for the price to break through.
How to Identify Support and Resistance
Method
How It Works
Example
Swing Highs/Lows
Look for obvious peaks and troughs
A swing high at 1.1100 becomes resistance
Round Numbers
Prices ending in .00 or .50
1.1000 is a psychological level
Prior Levels
Levels that worked in the past often work again
Support at 1.1000 that held three times
Moving Averages
Dynamic support/resistance. The The
200-day MA often acts as support
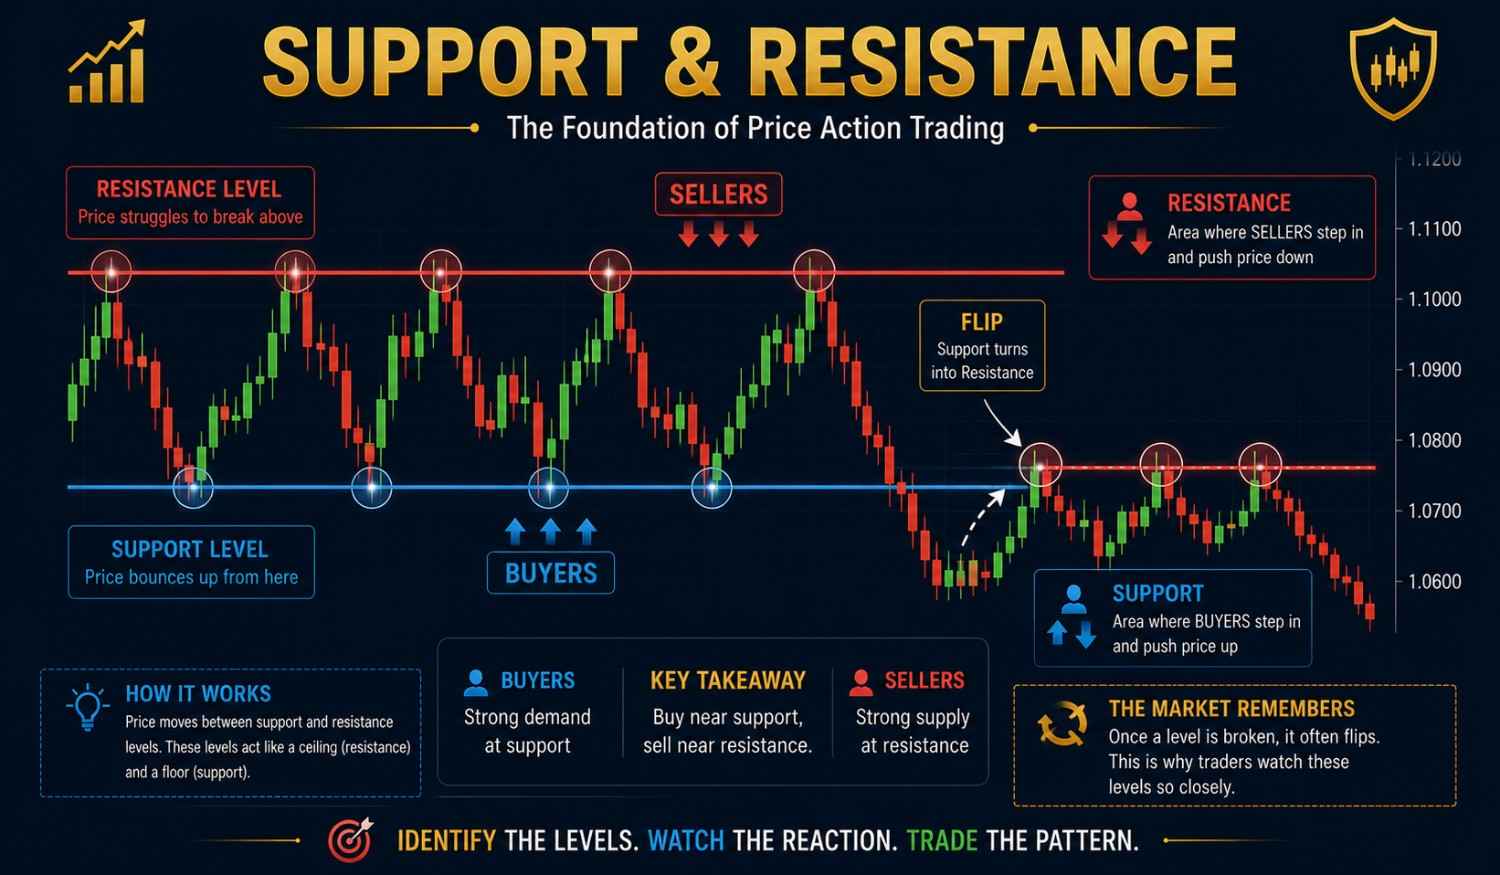
The “Flip” Phenomenon
A critical concept in how to read forex charts is that support and resistance can flip roles. Once a support level is breached, it very often delivers resistance, and vice versa.
🎯 Real-World Example:
Step 1: Price finds support at 1.1000 three times (support level established)
Step 2: Price breaks BELOW 1.1000 (support is breached)
Step 3: Price rallies back UP to 1.1000 (retesting the level)
Step 4: 1.1000 now acts as RESISTANCE (the level has flipped)
This flip phenomenon occurs because traders who bought near support now want to break even, creating selling pressure. This is a powerful concept in how to read forex charts.
Round Numbers: Psychological Levels
Trading psychology plays a huge factor in trading and can be viewed on the charts. Round numbers—price levels ending in .00 or .50—are particularly important because traders are attracted to them.
🎯 Real-World Example: If EUR/USD is approaching 1.1000, traders will place:
Sell limit orders at 1.1000 (expecting resistance)
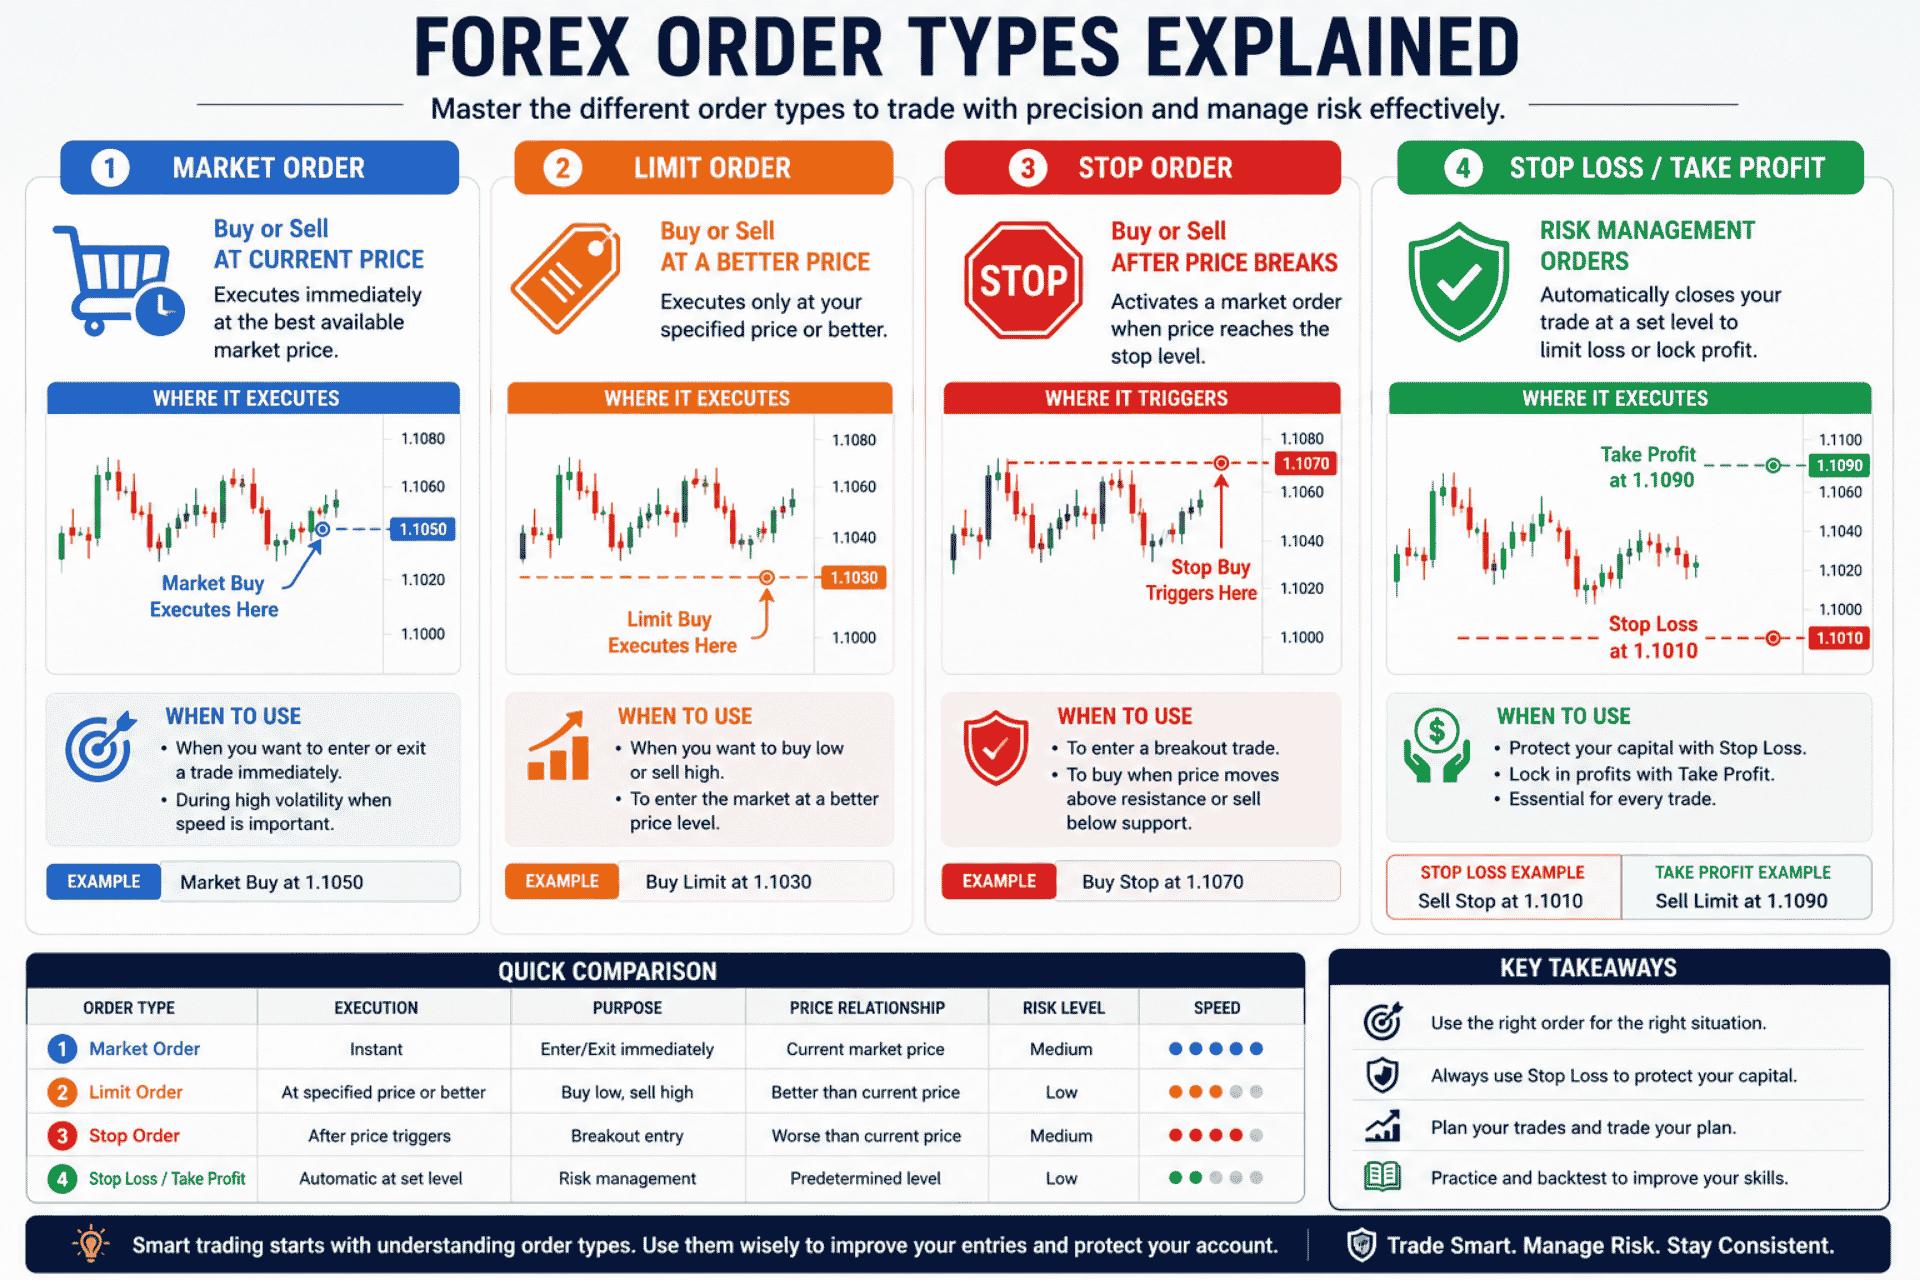
Buy stop orders above 1.1000 (expecting a breakout)
Protective stop-loss orders just beyond the level
Result: A collection of orders tends to congregate around these price points, making them highly significant. However, whipsaws around psychological levels are common, so think of them as zones, not exact laser lines, when learning how to read forex charts.
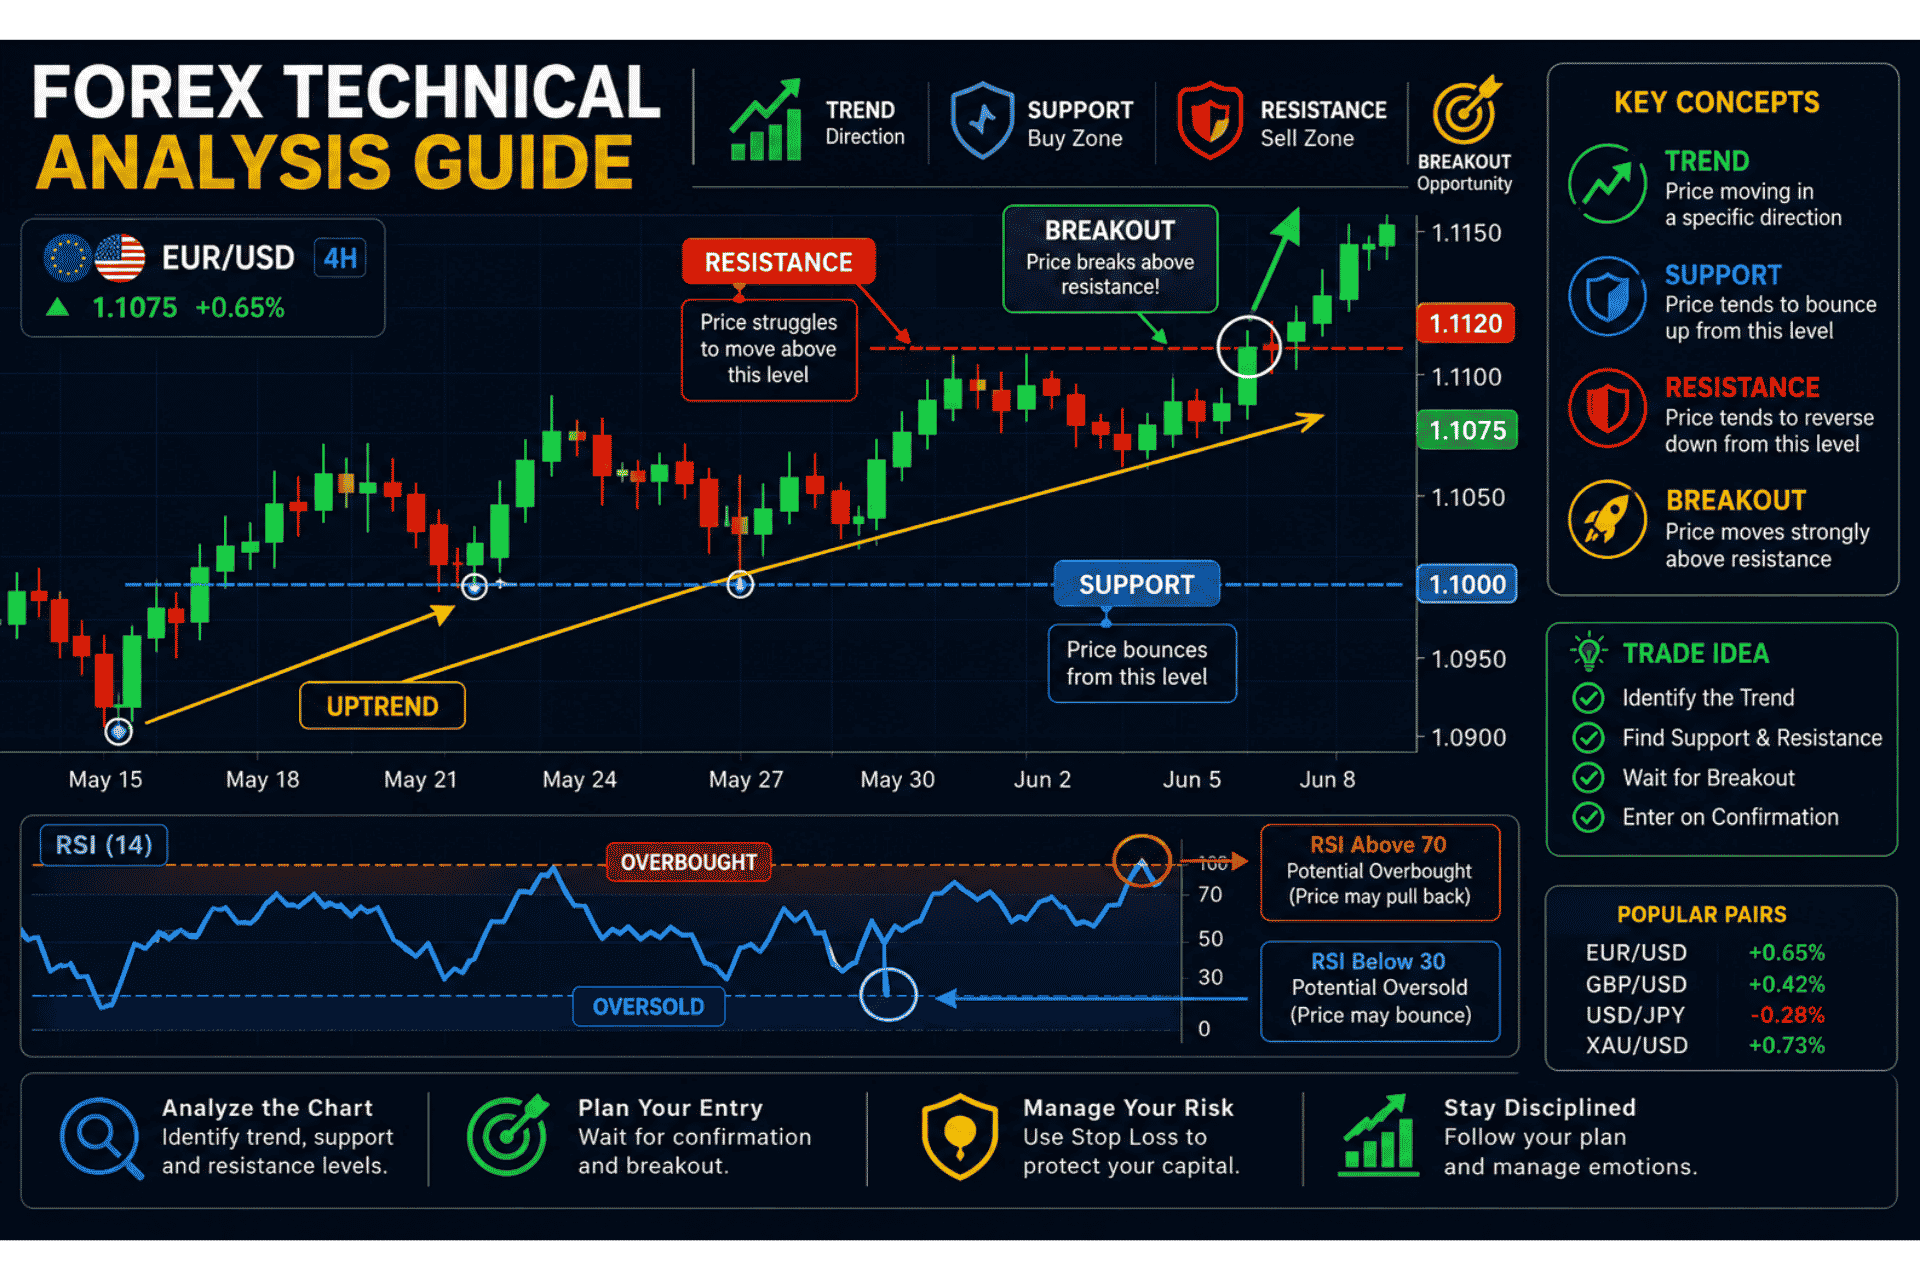
Support and resistance—the foundation of technical analysis
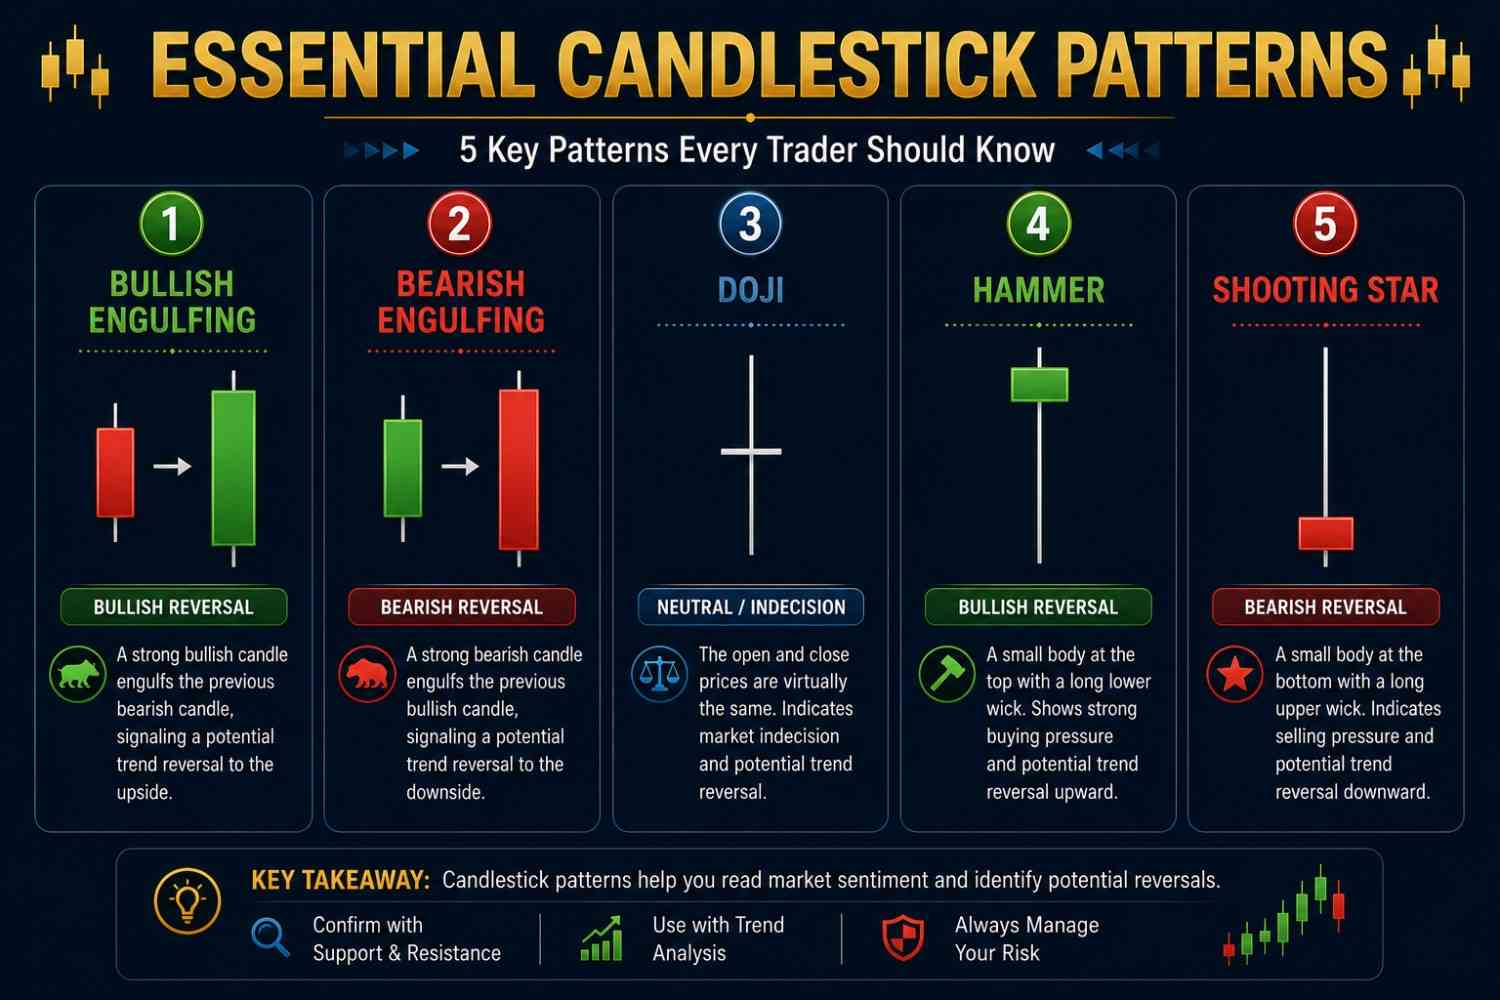
5 Candlestick Patterns Every Beginner Must Know
An entire technical analysis science has evolved regarding specific combinations of candlesticks that have predictive value. Here are the five most important patterns for beginners learning how to read forex charts.
1. Engulfing Pattern (Bullish and Bearish)
What It Looks Like: A two-candle pattern where the second candle’s body completely covers (engulfs) the first candle’s body.
Bullish Engulfing (Reversal from Downtrend to Uptrend):
First candle: Small bearish (red)
Second candle: Large bullish (green) that engulfs the first
Psychology: Buyers have overpowered sellers; momentum is shifting
Bearish Engulfing (Reversal from Uptrend to Downtrend):
First candle: Small bullish (green)
Second candle: Large bearish (red) that engulfs the first
Psychology: Sellers have overpowered buyers; momentum is shifting down
🎯 Real-World Example: Suppose EUR/USD has been falling steadily for weeks. In one session, it posts a small red candle, followed by a large green candle that engulfs it. The next day, the price gaps higher with strong volume, confirming the bullish reversal. This is a classic entry signal when learning how to read forex charts.
2. Doji
What It Looks Like: A candle where the opening and closing prices are equal (or very close), creating a cross shape.
Psychology: Complete indecision in the market. Neither buyers nor sellers could assert enough influence to move the price significantly.
When It Matters: A doji forming within an uptrend or downtrend may indicate a reversal is on the way.
🎯 Real-World Example: EUR/USD has been in a strong uptrend for two weeks. Suddenly, a doji forms. This suggests buyers are losing momentum. If the next candle is bearish, it confirms a potential reversal to the downside.
3. Hammer (Bullish Reversal)
What It Looks Like: A candle with a long lower wick and a small body near the top of the candle.
Psychology: Sellers pushed the price down during the period, but buyers stepped in aggressively and pushed the price back up. The long lower wick shows buyers’ strength.
When It Matters: At the bottom of a downtrend, a hammer signals a potential bullish reversal.
🎯 Real-World Example: EUR/USD has been falling for several days. A hammer forms with a long lower wick and a small green body near the top. This indicates buyers have stepped in. You could enter a long position with a stop-loss below the hammer’s low as explained when learning how to read forex charts.
4. Shooting Star (Bearish Reversal)
What It Looks Like: A candle with a long upper wick and a small body near the bottom of the candle.
Psychology: Buyers pushed the price up during the period, but sellers stepped in aggressively and pushed the price back down. The long upper wick shows sellers’ strength.
When It Matters: At the top of an uptrend, a shooting star signals a potential bearish reversal.
5. Inside Bar
What It Looks Like: A small candle that is completely within the range of the previous candle (the “mother bar”).
Psychology: Consolidation and indecision. The market is coiling up for a potential breakout.
When It Matters: After a strong trend, an inside bar can signal a continuation or a reversal. Trade the break in the direction of the overall trend context.
Five essential candlestick patterns every beginner must know
Practical Example: How to Read a Forex Chart Step-by-Step
Let’s walk through a real-world example of how to read forex charts using the EUR/USD 15-minute chart.
Context
You are watching EUR/USD on a 15-minute chart. You want to find a trading opportunity.
Step 1: Identify the Trend
You look at the H4 chart first (top-down analysis)
The H4 chart shows that EUR/USD is in an uptrend (higher highs and higher lows)
The 20-period EMA is above the 50-period EMA, confirming bullish momentum
Step 2: Mark Support and Resistance
You mark a key resistance level at 1.0900 (price has been rejected here twice)
You mark a key support level at 1.0850 (price has bounced here three times)
Step 3: Watch for a Breakout
Price breaks above 1.0900 with a strong bullish candle
This is a breakout of resistance—a potential entry signal
Step 4: Wait for the Retest
Instead of buying immediately, you wait for the price to retest 1.0900 from above
The retest happens—the price comes back down to 1.0900 and then bounces up
A bullish rejection candle forms at the retest level
Step 5: Execute the Trade
Entry: Buy at 1.0902 (after bullish rejection candle confirms)
Stop-Loss: 8 pips below the rejection low at 1.0894
Take-Profit: 12 pips above at 1.0914 (1.5R target)
Step 6: Position Sizing
Account: $1,000
Risk per trade: 1% = $10
Stop distance: 8 pips
Required pip value: $10 ÷ 8 = $1.25 per pip
On EUR/USD, 1.00 lot ≈ $10 per pip, so 0.125 lots ≈ $1.25 per pip
Result: This is how you translate a written risk rule into a real lot size before you hit the button.
Your Chart-Reading Checklist
Before you click buy or sell, use this checklist to ensure you have properly analyzed the chart:
Use Candlesticks for analysis—they give you the most information
Flip to a Line Chart to verify—check the overall slope/trend
Pick H1 or H4 to start—less noise than M1 or M5
Mark Support/Resistance from higher timeframes—refine on lower timeframes
Add one indicator (EMA or RSI) for confirmation—No clutter
Define entry, stop-loss, and take-profit in writing
Journal the trade idea—including why you didn’t take marginal setups
Common Mistakes When Learning How to Read Forex Charts
Mistake
Why It’s a Problem
How to Fix
Using too many indicators
Analysis paralysis
Stick to 2-3 tools
Worshipping single candles
Out of context, a candle is meaningless
Always consider the trend and key levels
Entering before the candle closes
Half-formed candles lie
Wait for confirmation
Hiding stops inside obvious wikis.
Gets stopped out by market noise
Place stops beyond clear levels
Ignoring the higher timeframe
Missing the big picture
Always start with the weekly/daily chart
Chasing breakouts
Often too late
Wait for the retest of the broken level
Conclusion: Your Chart-Reading Journey Starts Here
Learning how to read forex charts is the foundation of successful trading. It transforms you from a gambler into an analyst, from someone who hopes the market moves in their favor to someone who understands why it moves.
Key Takeaways:
Candlestick charts are your best tool—they show you open, high, low, and close prices in an easy-to-read format
Support and resistance are the foundation—They tell you where buyers and sellers are likely to step in
Always start with the higher timeframe—The weekly and daily charts show the big picture
Learn five key patterns—Engulfing, Doji, Hammer, Shooting Star, Inside Bar
Never trade a pattern without context—A hammer in the middle of nowhere is just a funny stick
Journal every trade—Write down why you entered and why you exited
Practice on a demo account—Before risking real money, practice your chart reading on a demo account
🎯 Final Thought: The charts are not just lines and candles—they are a visual representation of human psychology, fear, and greed. By learning how to read forex charts, you are learning how to read the market’s emotional state. Master this skill, and you will trade with confidence, discipline, and clarity.
FAQ
1. What is the best chart type for beginners?
Candlestick charts are the best choice for beginners. They show the most information (open, high, low, and close) in an easy-to-read, easy-to-understand format, especially when focusing on how to read forex charts.
2. How do I identify a trend on a chart?
An uptrend is characterized by higher highs and higher lows. A downtrend is characterized by lower highs and lower lows. A ranging market moves sideways between support and resistance.
3. What is the most reliable candlestick pattern?
The engulfing pattern is considered highly reliable because it shows a clear shift in momentum from buyers to sellers (or vice versa). However, always consider the context—patterns are more reliable at key support/resistance levels.
4. How long should I practice reading charts?
Stay on a demo account until you can consistently identify trends, support/resistance, and key patterns without hesitation. Most experts recommend 30-60 days of practice before trading with real money after mastering how to read forex charts.
5. Should I use indicators?
Indicators should confirm what your eyes see, not replace them. Start with just one or two—like a 20-period and 50-period EMA—and add more only when you understand how to read raw price action.
6. What is the difference between a support and a resistance level?
Support is a “floor” where buyers typically step in. Resistance is a “ceiling” where sellers typically step in. Both are critical for setting entry, stop-loss, and take-profit levels, making it an important lesson on how to read forex charts.
Further Reading
To deepen your understanding of forex trading, we recommend exploring these additional resources from Finwirestack:
Disclaimer: Trading forex and CFDs involves significant risk of loss. It is not suitable for all investors. You should carefully consider your investment objectives, level of experience, and risk appetite before trading. Never trade with money you cannot afford to lose. The information provided in this article is for educational purposes only and does not constitute financial advice.
Forex risk management is the single most important skill any trader can develop. Without it, even the most profitable strategy will eventually fail. With it, even a mediocre strategy can become consistently profitable.
Here is the hard truth that most beginners discover too late: forex risk management is not about avoiding losses—it is about controlling them. Professional traders understand that losses are inevitable. They accept them, learn from them, and move on. The difference between professionals and amateurs is not the number of winning trades. It is how they manage risk when they lose.
This comprehensive guide will teach you forex risk management with seven proven strategies that professional traders use to protect their capital. You will learn:
How to calculate position sizing with precision
Where to place stop-loss orders for maximum effectiveness
How to use risk-reward ratios to stay profitable
The psychology of trading and how to master it
Common risk management mistakes and how to avoid them
By the end, you will understand forex risk management well enough to protect your account and trade with confidence.
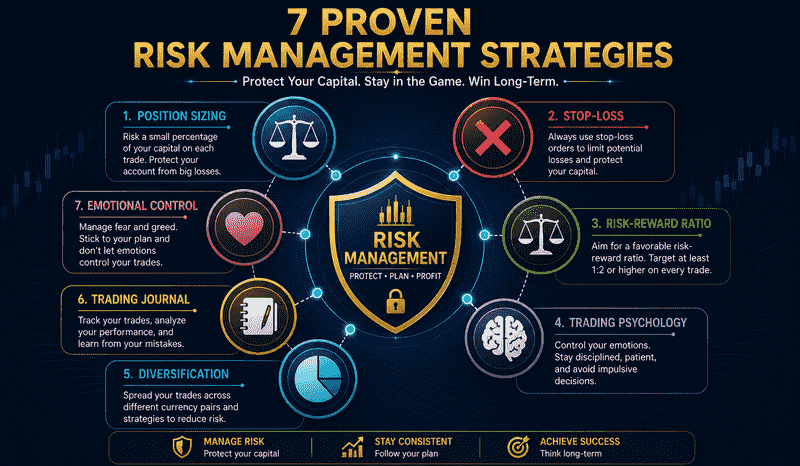
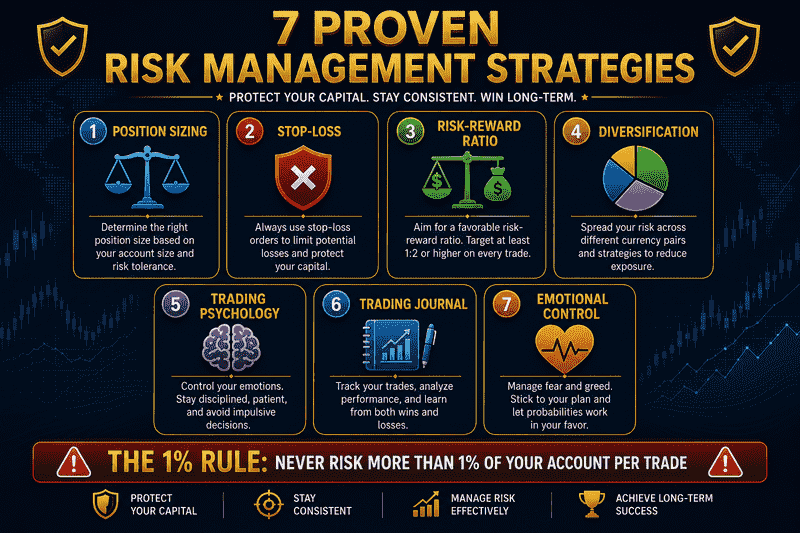
Figure 1: Forex risk management—7 proven strategies to protect your capital
What Is Forex Risk Management?
Forex risk management is the process of identifying, assessing, and controlling potential losses in your trading account. It is the discipline that separates successful traders from those who blow up their accounts.
🎯 Real-World Analogy: Think of forex risk management like driving a car. You don’t drive without a seatbelt, airbags, and brakes. Risk management is your seatbelt—it doesn’t prevent accidents, but it protects you when they happen. Similarly, forex risk management doesn’t prevent losing trades, but it ensures those losses don’t destroy your account.
The Golden Rule of Forex Risk Management
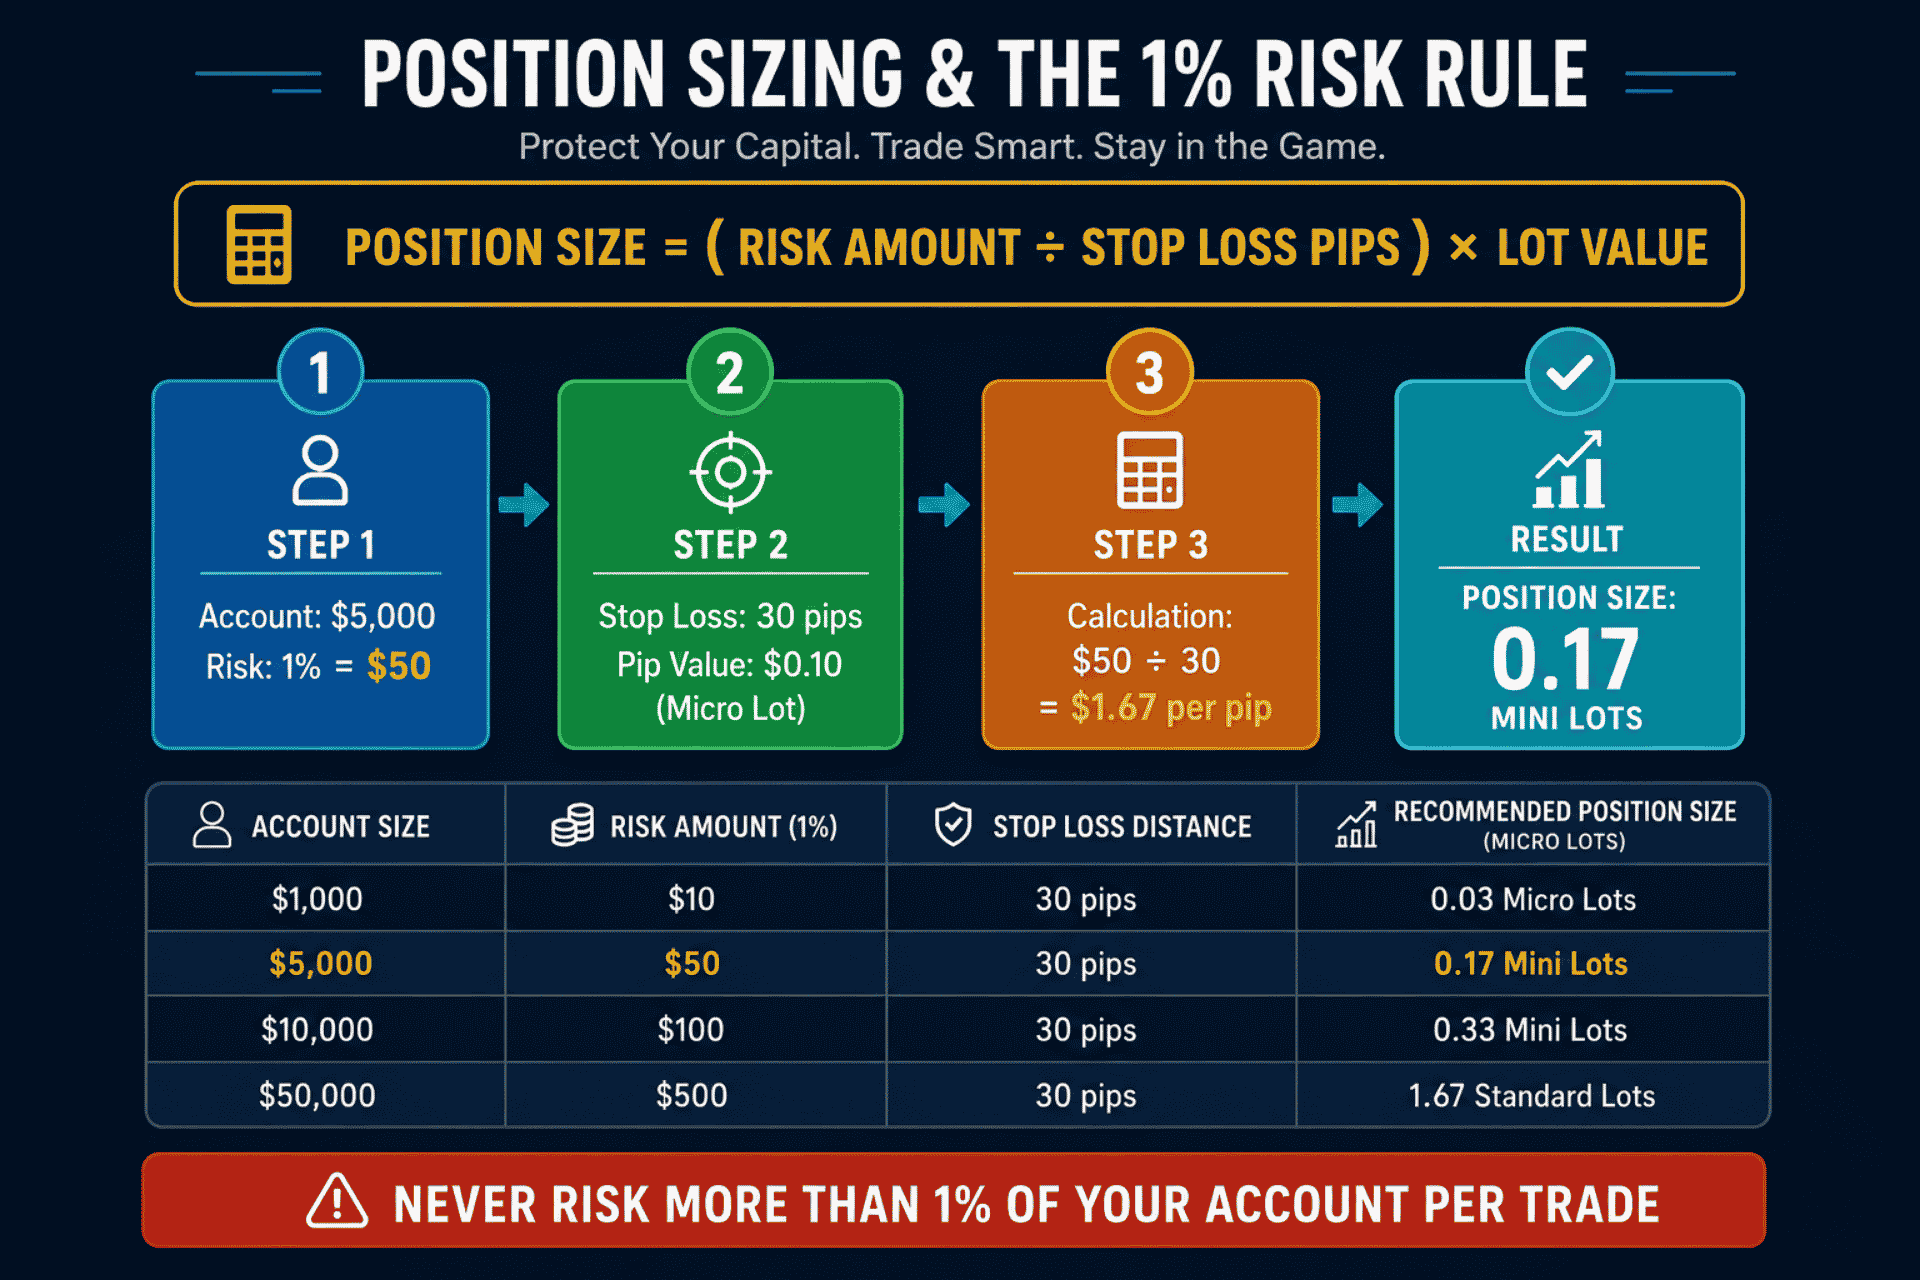
Never risk more than 1-2% of your trading account on any single trade.
This is the most important rule in forex risk management. If you follow this rule, you can survive a series of losing trades and still have enough capital to continue trading.
Account Size
1% Risk
2% Risk
$500
$5
$10
$1,000
$10
$20
$5,000
$50
$100
$10,000
$100
$200
$50,000
$500
$1,000
🟦 Blue Highlight: The 1% rule is the foundation of forex risk management. It ensures that no single trade can wipe out your account, giving you the staying power to weather inevitable losses.
Strategy #1: Position Sizing — The Foundation of Forex Risk Management
Position sizing is the most critical component of forex risk management. It determines how much of your capital you are risking on each trade. Getting this right is essential for long-term survival.
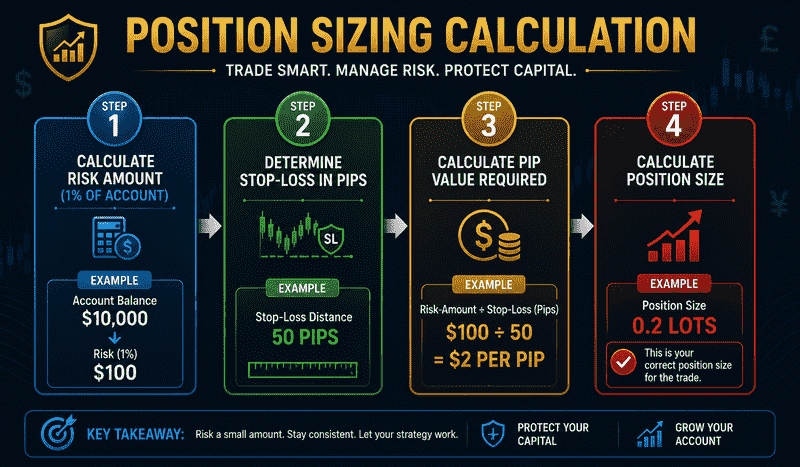
The Position Sizing Formula
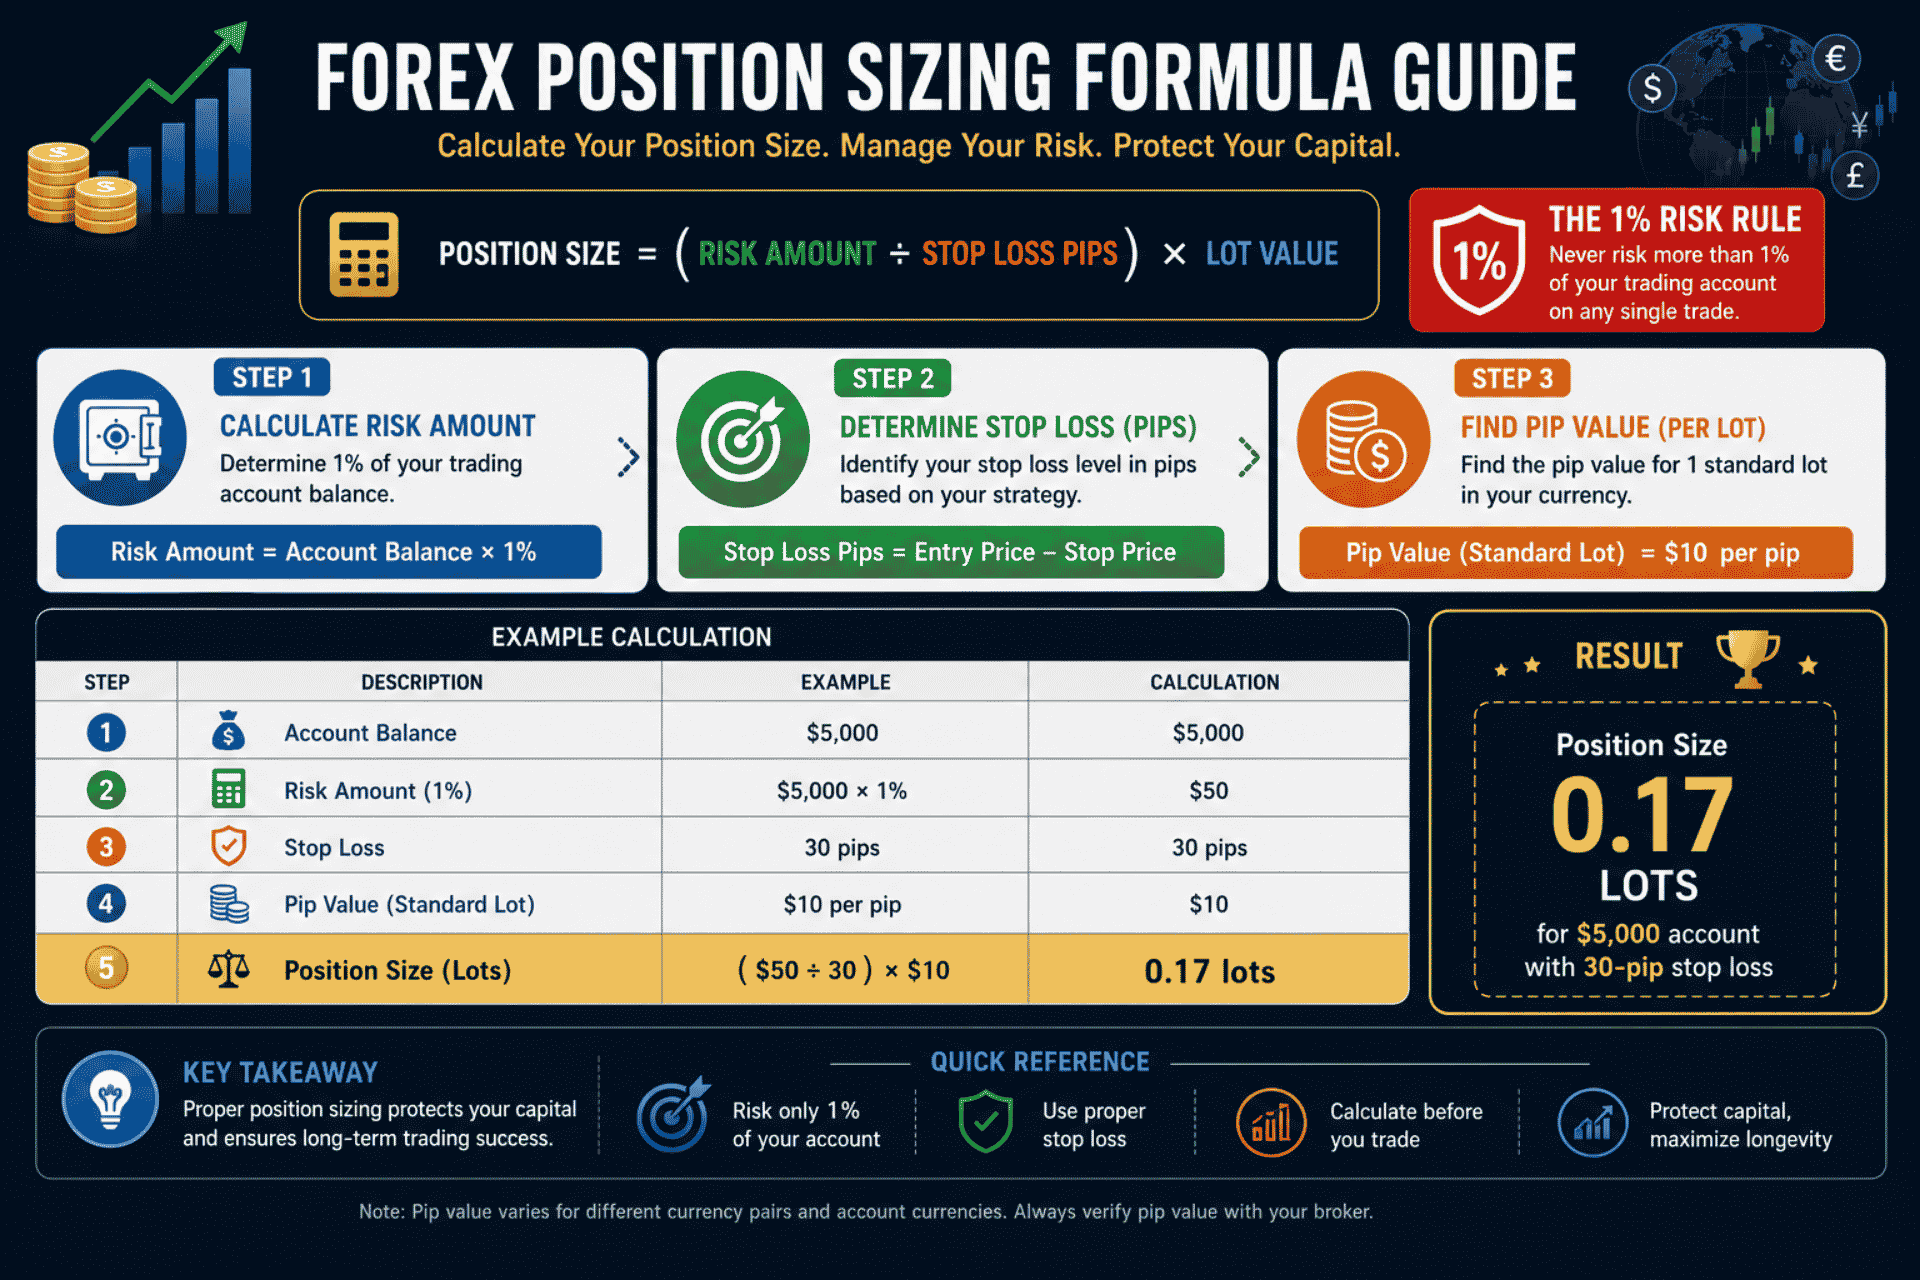
Position Size = (Risk Amount ÷ Stop Loss Distance) × Pip Value
Let’s break this down step by step.
🧮 Position Sizing Calculation
Scenario: You have a $10,000 account. You want to risk 1% per trade. Your stop-loss is 50 pips on EUR/USD.
Step 1: Calculate your risk amount
1% of $10,000 = **$100** (This is the maximum you can lose on this trade)
Step 2: Determine your stop-loss in pips
Stop-loss = 50 pips
Step 3: Calculate pip value for your chosen lot size
1 standard lot = $10 per pip
1 mini lot = $1 per pip
1 micro lot = $0.10 per pip
1 nano lot = $0.01 per pip
Step 4: Calculate the required pip value
Risk per pip = $100 ÷ 50 pips = **$2.00 per pip**
Step 5: Determine the lot size
Since 1 mini lot = $1 per pip, you need 2 mini lots (0.2 lots)
✅ Result: Your position size should be 0.2 lots (2 mini lots).
📊 Table: Position Sizing Examples
Account Size
Risk %
Risk $
Stop Loss (Pips)
Pip Value Needed
Position Size
$1,000
1%
$10
50 pips
$0.20
0.02 lots
$1,000
1%
$10
100 pips
$0.10
0.01 lots
$5,000
1%
$50
50 pips
$1.00
0.10 lots
$5,000
1%
$50
30 pips
$1.67
0.17 lots
$10,000
1%
$100
50 pips
$2.00
0.20 lots
$10,000
1%
$100
30 pips
$3.33
0.33 lots
Figure 2: Position sizing formula — the foundation of forex risk management
Strategy #2: Stop-Loss Placement — Your Safety Net
A stop-loss is a pre-set order that automatically closes your trade if the market moves against you. It is the most essential tool in forex risk management.
Types of Stop-Loss Orders
Type
Definition
Best Used For
Fixed Stop-Loss
Set at a specific price level
All trades
Trailing Stop-Loss
Moves with the price in your favor
Trending markets
Volatility-Based Stop-Loss
Based on average true range
Volatile markets
Time-Based Stop-Loss
Closes after a set time
Day trading
Where to Place Your Stop-Loss
Placement Method
How It Works
Example
Below Support
Place just below key support level
Support at 1.1000 → Stop at 1.0980
Above Resistance
Place just above key resistance level
Resistance at 1.1100 → Stop at 1.1120
Volatility-Based
Use ATR (Average True Range)
ATR = 50 pips → Stop at 2× ATR = 100 pips
Fixed Distance
Same distance for every trade
Always 30 pips regardless of the market
🎯 Real-World Example
Scenario: You buy EUR/USD at 1.1050. You want to place your stop-loss.
Option 1 (Support-Based):
Support level at 1.1000
Place stop-loss at 1.0980 (20 pips below support)
Risk: 70 pips
Option 2 (Volatility-Based):
ATR (Average True Range) = 40 pips
Place stop-loss at 2 × ATR = 80 pips
Risk: 80 pips
Option 3 (Fixed Distance):
Place stop-loss at 30 pips below entry
Stop-loss at 1.1020
Risk: 30 pips
🟦 Blue Highlight: In forex risk management, the stop-loss placement method you choose should match your trading strategy. Swing traders may use support-based stops, while day traders often use fixed-distance stops.
Strategy #3: Risk-Reward Ratio — The Key to Profitability
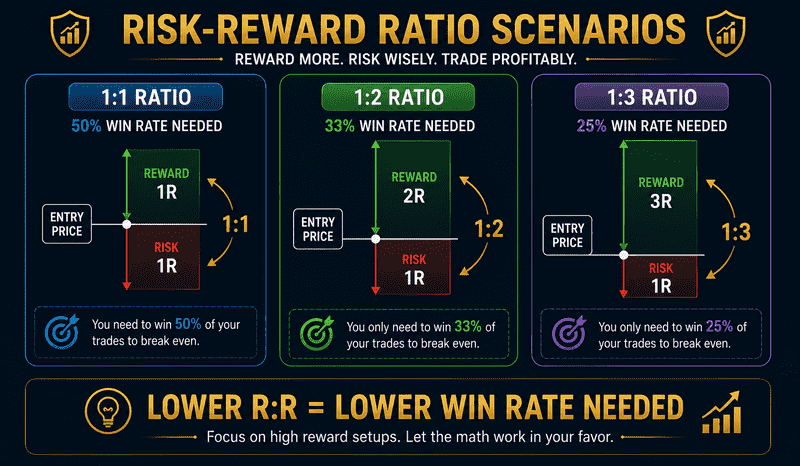
The risk-reward ratio (R:R) compares the potential profit of a trade to the potential loss. It is a critical concept in forex risk management because it determines how profitable you can be even with a low win rate.
📊 Table: Break-Even Win Rates by Risk-Reward Ratio
Risk-Reward Ratio
Break-Even Win Rate
Minimum Profit Win Rate
1:1
50%
50%+
1:1.5
40%
40%+
1:2
33%
33%+
1:2.5
28.5%
28.5%+
1:3
25%
25%+
1:4
20%
20%+
🧮 Risk-Reward Calculation
Scenario: You have a 50-pip stop-loss and a 100-pip take-profit.
✅ Result: With a 1:2 risk-reward ratio, you only need to win 33% of your trades to break even. This is why professional traders focus on risk-reward ratio rather than win rate.
🔴 Red Highlight: Many beginners focus on having a high win rate (70%+). But in forex risk management, a trader with a 40% win rate and a 1:3 risk-reward ratio will be far more profitable than a trader with a 70% win rate and a 1:1 ratio. Always prioritize risk-reward over win rate.
Figure 3: Risk-reward ratio — the key to consistent forex profitability
Strategy #4: Diversification — Spreading Your Risk
Diversification is an often-overlooked aspect of forex risk management. It involves spreading your trading across different currency pairs, timeframes, and strategies to reduce overall risk.
Types of Diversification
Type
Description
Example
Currency Diversification
Trade different currency pairs
EUR/USD, GBP/JPY, AUD/NZD
Strategy Diversification
Use different trading strategies
Trend following and mean reversion
Timeframe Diversification
Trade different timeframes
Day trading + Swing trading
Correlation Diversification
Trade uncorrelated pairs
EUR/USD + USD/CHF (correlated) = bad
📊 Table: Currency Pair Correlations
Pair 1
Pair 2
Correlation
Diversification Effect
EUR/USD
GBP/USD
✅ High Positive (+85%)
❌ Poor
EUR/USD
USD/CHF
❌ High Negative (-90%)
❌ Poor
EUR/USD
USD/JPY
⚠️ Moderate Negative (-50%)
✅ Good
EUR/USD
AUD/USD
⚠️ Moderate Positive (+65%)
⚠️ Moderate
EUR/USD
GBP/JPY
⚠️ Moderate Positive (+60%)
⚠️ Moderate
EUR/USD
USD/CAD
⚠️ Moderate Negative (-55%)
✅ Good
🟦 Blue Highlight: In forex risk management, diversification means not having all your risk concentrated in one currency pair or one strategy. If you trade correlated pairs, you are essentially doubling your risk.
Strategy #5: Trading Psychology — Managing Your Emotions
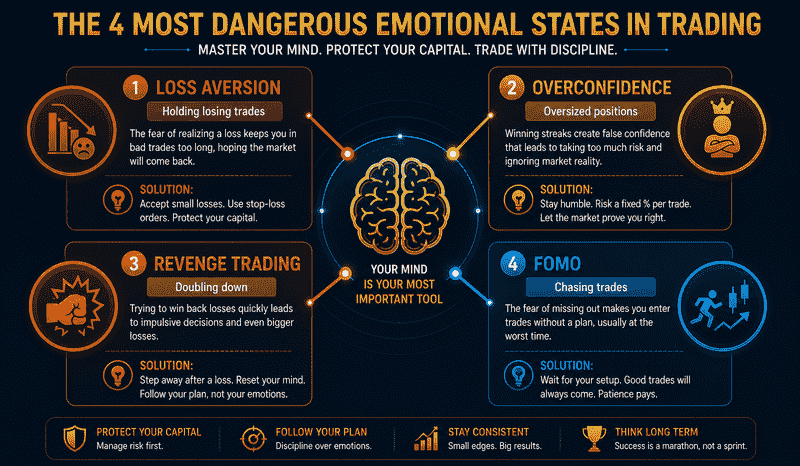
Trading psychology is the most underrated aspect of forex risk management. Your emotions—fear, greed, hope, and regret—can destroy your account faster than any losing trade.
Common Psychological Biases
Bias
Description
Impact on Trading
Loss Aversion
Fear of losses leads to poor decisions
Holding losing trades too long
Overconfidence
Past success leads to excessive risk
Taking oversized positions
Revenge Trading
Chasing losses to “get even”
Doubling down on losing trades
FOMO (Fear of Missing Out)
Jumping into trades late
Buying tops and selling bottoms
Anchoring
Fixating on a specific price
Refusing to cut losses
🎯 Real-World Example: Revenge Trading
Scenario: You lose $200 on a trade. Your emotions take over.
Step 1: The Loss
You feel frustrated and angry
You want to “get your money back.”
Step 2: The Revenge Trade
You double your position size (from 0.2 to 0.4 lots)
You ignore your normal risk management rules
You enter a trade without a proper setup
Step 3: The Result
The trade moves against you
You lose another $400
Your account is now down $600
✅ The Solution: In forex risk management, after a loss, you should step away from the screen. Take a break. Clear your head. Return when you are calm and can think clearly.
Figure 4: Trading psychology—mastering your emotions is essential for effective forex risk management
Strategy #6: Keep a Trading Journal
A trading journal is one of the most powerful tools in forex risk management. It is a record of every trade you take, including the reasons for entry, the outcome, and the lessons learned.
What to Record in Your Trading Journal
Field
Why It Matters
Date & Time
Track your trading patterns
Currency Pair
Identify your best-performing pairs
Trade Direction
Buy or sell
Entry Price
The price you entered at
Exit Price
The price you exited at
Stop-Loss Level
Where you placed your stop-loss
Take-Profit Level
Where you placed your take-profit
Position Size
The lot size you used
Profit/Loss
The final outcome
Reason for Trade
Why you entered
Emotional State
How you felt during the trade
Lessons Learned
What you will do differently
🎯 Real-World Example: Journal Entry
Date: 2026-07-15 Pair: EUR/USD Direction: Buy Entry: 1.1050 Exit: 1.1070 (Take-Profit hit) Stop-Loss: 1.1020 Position Size: 0.1 mini-lots Profit: +$20 Reason: Breakout above resistance with RSI confirmation Emotional State: Calm, confident Lesson: My breakout strategy worked well. Continue to trust my analysis.
🔴 Red Highlight: In forex risk management, if you don’t track your trades, you can’t learn from them. A trading journal turns your trading experience into a powerful learning tool.
Strategy #7: Emotional Control and Discipline
Emotional control is the most difficult aspect of forex risk management. It requires discipline, patience, and the ability to follow your trading rules even when your emotions are telling you otherwise.
Rules for Emotional Control
Rule
Why It Matters
Take Breaks
Prevents emotional decision-making
Stick to Your Plan
Removes impulsive decisions
Accept Losses
Losses are part of trading
Don’t Chase Trades
Avoids buying tops and selling bottoms
Stay Consistent
Builds discipline over time
Review Your Trades
Learn from both wins and losses
🎯 Real-World Analogy: Emotional control in forex risk management is like a pilot following a checklist. A pilot doesn’t make decisions based on emotions—they follow the procedures. Similarly, a successful trader follows their trading plan regardless of emotional state.
Figure 5: Forex risk management — 7 proven strategies to protect your capital
Common Risk Management Mistakes to Avoid
Mistake
Why It’s Dangerous
How to Fix
Risking too much per trade
One loss can wipe out your account
Risk 1-2% maximum
Not using stop-loss
Losses can spiral out of control
Always use a stop-loss
Moving the stop-loss further away
Turns small losses into big ones
Stick to your original stop loss.
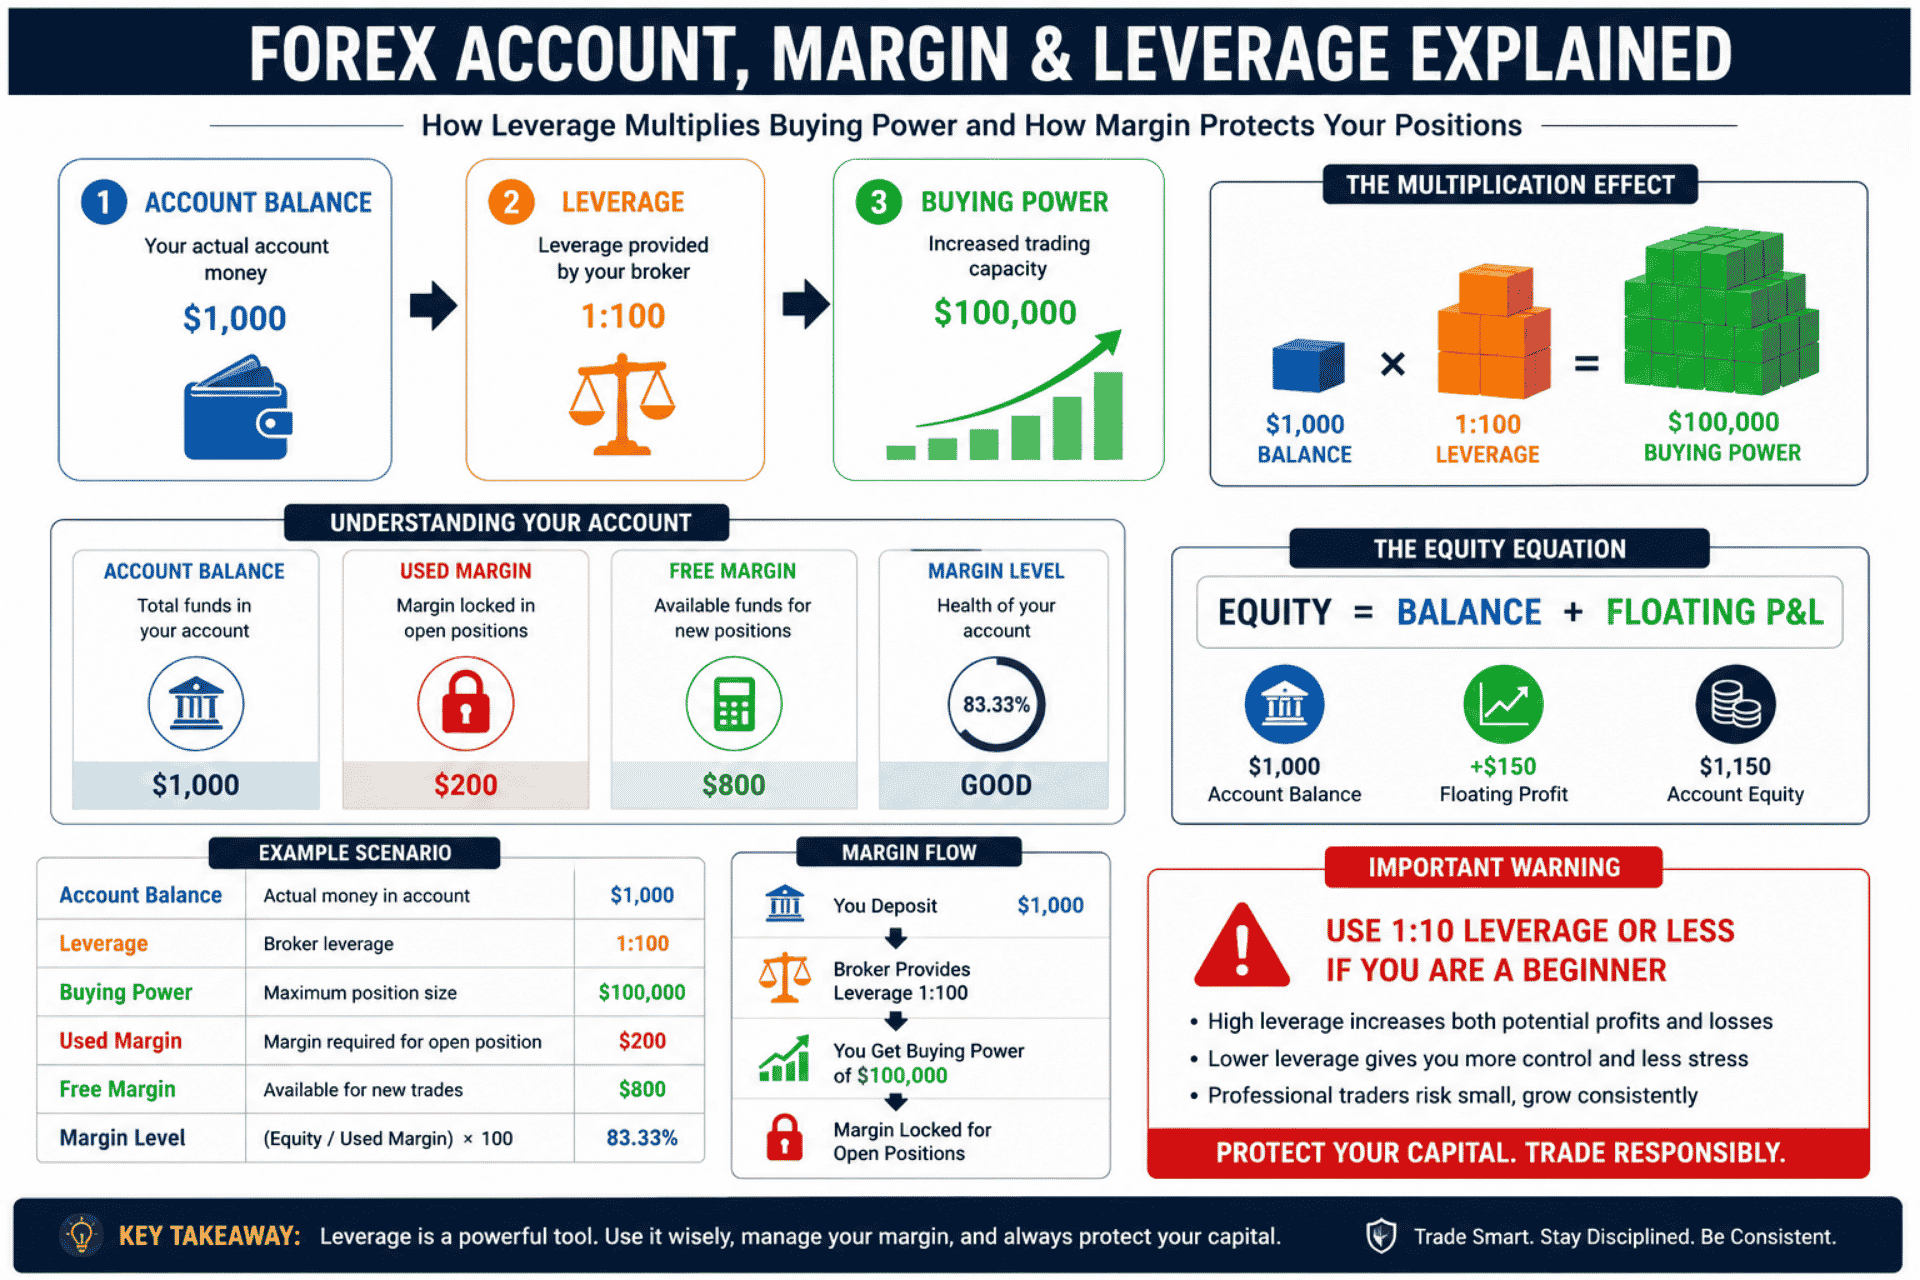
Using too much leverage
Amplifies both gains and losses
Use 1:5 to 1:10 maximum
Revenge trading
Chasing losses leads to bigger losses
Step away after a loss
No trading plan
Inconsistent decision-making
Create and follow a plan
Ignoring correlations
Doubling risk without knowing it
Check pair correlations
Conclusion: Master Forex Risk Management
Forex risk management is not optional. It is the foundation of every successful trading career. Without it, even the best strategy will fail. With it, even a mediocre strategy can become consistently profitable.
Key Takeaways:
The 1% Rule is non-negotiable—never risk more than 1% of your account per trade
Position sizing is essential—calculate your position size before every trade
Always use a stop-loss—It is your most important risk management tool
Risk-reward ratio matters more than win rate—Focus on R: R, not win rate
Diversification reduces risk—Trade different pairs, timeframes, and strategies
Trading psychology is critical—control your emotions, or they will control you
A trading journal is your best teacher—record, review, and learn from every trade
🎯 Final Thought: The goal of forex risk management is not to avoid losses. It is to survive long enough to let your profitable trades outnumber your losing ones. Master these 7 proven strategies, and you will protect your capital, build confidence, and trade with discipline.
FAQ
1. What is the 1% rule in forex?
The 1% rule means you never risk more than 1% of your trading account on any single trade. With a $10,000 account, your maximum loss per trade is $100.
2. How do I calculate position size?
Position Size = (Risk Amount ÷ Stop-Loss Distance) × Pip Value. For example, with $10,000 risking 1% ($100), a 50-pip stop-loss, and $2 per pip, your position size is 0.2 lots.
3. What is a good risk-reward ratio?
A minimum of 1:2 is recommended. This means you risk $1 to make $2. With a 1:2 ratio, you only need a 33% win rate to break even.
4. Where should I place my stop-loss?
Place your stop-loss below support levels (for long trades) or above resistance levels (for short trades). You can also use volatility-based stops using the ATR indicator.
5. How much leverage should I use?
Beginners should use a 1:5 to 1:10 leverage maximum. Higher leverage amplifies both profits and losses and can quickly blow up your account.
6. How can I control my emotions while trading?
Use a trading plan, take breaks after losses, stick to your risk management rules, and keep a trading journal to track your emotional patterns.
7. Why is a trading journal important?
A trading journal helps you identify patterns in your trading, learn from your mistakes, and improve your decision-making over time.
Further Reading
To deepen your understanding of forex trading, we recommend exploring these additional resources from Finwirestack:
Disclaimer: Trading forex and CFDs involves significant risk of loss. It is not suitable for all investors. You should carefully consider your investment objectives, level of experience, and risk appetite before trading. Never trade with money you cannot afford to lose. The information provided in this article is for educational purposes only and does not constitute financial advice.
Central banks and forex share one of the most powerful relationships in global finance. When a central bank speaks, the entire currency market listens. When it acts, prices can move hundreds of pips in minutes.
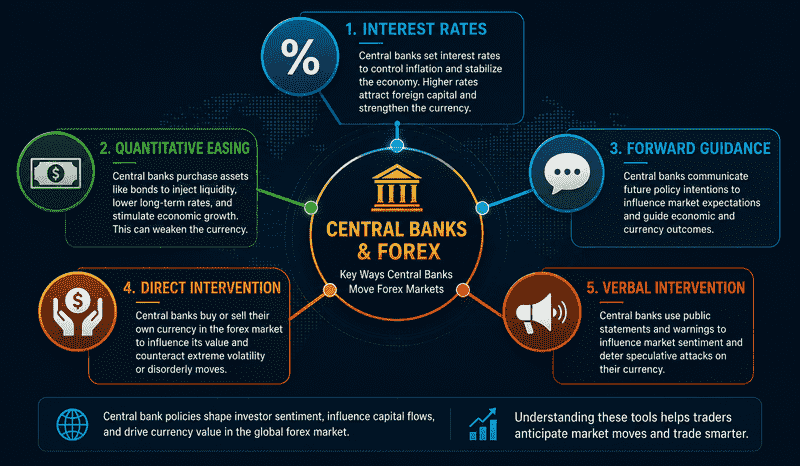
But here’s what many traders don’t fully understand: central banks and forex are connected through predictable mechanisms—interest rates, quantitative easing, forward guidance, and direct intervention. These aren’t mysterious forces. They are tools that central banks use deliberately, and traders who understand them can position themselves ahead of major moves.
This guide breaks down exactly how central banks and forex interact. You will learn:
What central banks are and why they matter
The 5 most powerful ways central banks move currencies
How to interpret central bank communications
Real trading strategies for central bank events
Common mistakes traders make and how to avoid them
By the end, you will understand the central banks and forex relationship well enough to trade with conviction around major policy announcements.
What Are Central Banks?
A central bank is the primary regulatory authority for a country’s currency and monetary system. It controls the money supply, manages interest rates, and oversees the stability of financial institutions. Central banks also act as the lender of last resort in times of financial distress, providing liquidity to market participants when needed.
🎯 Real-World Analogy: Think of a central bank as the “pilot” of a country’s economy. Just as a pilot adjusts altitude, speed, and direction to keep the plane stable, a central bank adjusts interest rates, money supply, and policy to keep the economy stable.
The World’s Most Influential Central Banks
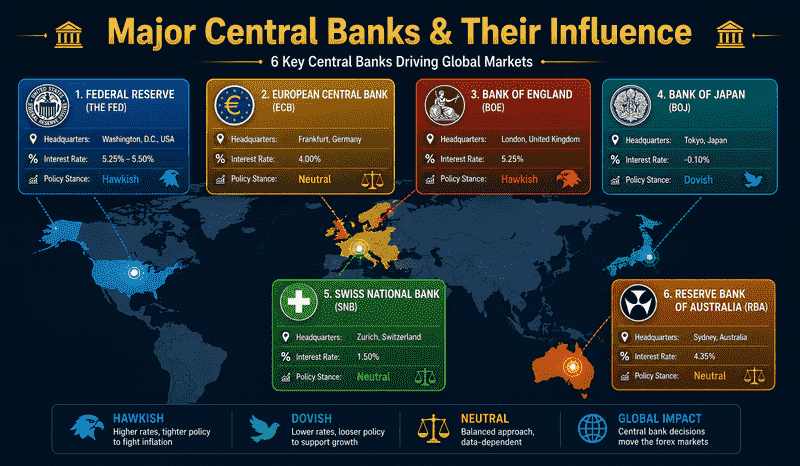
Central Bank
Country/Region
Currency
Key Focus
Federal Reserve (Fed)
United States
USD
Maximum employment, stable prices
European Central Bank (ECB)
Eurozone
EUR
Price stability, economic growth
Bank of England (BoE)
United Kingdom
GBP
Price stability, financial stability
Bank of Japan (BoJ)
Japan
JPY
Price stability, economic growth
Swiss National Bank (SNB)
Switzerland
CHF
Price stability, exchange rate stability
Reserve Bank of Australia (RBA)
Australia
AUD
Price stability, full employment
Why Central Banks Matter for Forex Traders
Central banks are the single most important force in the forex market. Their decisions affect:
Interest rates — The primary driver of currency values
Money supply — Affects inflation and purchasing power
Currency interventions — Direct buying/selling of currencies
🟦 Blue Highlight: Understanding central banks and forex is not optional for serious traders. Central bank decisions account for some of the largest and most predictable moves in the currency markets.
Way #1: Interest Rate Decisions
Interest rates are the most powerful tool in the central banks and forex relationship. By adjusting benchmark rates, central banks influence borrowing costs, money supply, and ultimately, currency values.
Lower rates reduce investment appeal, encouraging capital outflows
Rate Hold (Neutral)
⚠️ Minimal Impact
The market had already priced in expectations
🎯 Real-World Example
Scenario: The Federal Reserve raises interest rates from 4.50% to 4.75%.
Step 1: Market Reaction
USD/JPY jumps 100 pips immediately
EUR/USD drops 80 pips
US Treasury yields rise
Step 2: Why It Happened
Higher rates = higher yield on US bonds
Investors buy USD to purchase US bonds
Increased demand = stronger USD
Step 3: Trader Decision
A trader who anticipated the hike would have bought USD/JPY before the announcement
Profit potential: 100+ pips
🔴 Red Highlight: Trading interest rate decisions requires caution. Markets often “price in” expected moves before the announcement. The biggest moves happen when the actual decision differs from expectations.
Way #2: Quantitative Easing (QE) and Asset Purchases
Quantitative easing is an unconventional monetary policy where central banks buy government securities or other assets to inject liquidity into financial markets and lower long-term interest rates.
How QE Affects Currency Value
QE Action
Effect on Currency
Mechanism
Expanding QE
❌ Currency Weakens
Increases the money supply, devaluing the currency
Reducing QE (Tapering)
✅ Currency Strengthens
Reduces money supply, supporting the currency
Ending QE
✅ Currency Strengthens
Removes liquidity, potentially increasing yields
🎯 Real-World Example: Bank of Japan
The Bank of Japan has been a textbook example of central banks and forex interaction through QE.
Situation: The BoJ has been conducting massive QE programs for years to combat deflation.
Impact on JPY:
Increased money supply = weaker JPY
USD/JPY rose from 100 to 150+ over several years
Each QE expansion announcement caused the JPY to drop
Lesson: Understanding central banks and forex means understanding that QE is fundamentally bearish for a currency in the long term.
Way #3: Forward Guidance
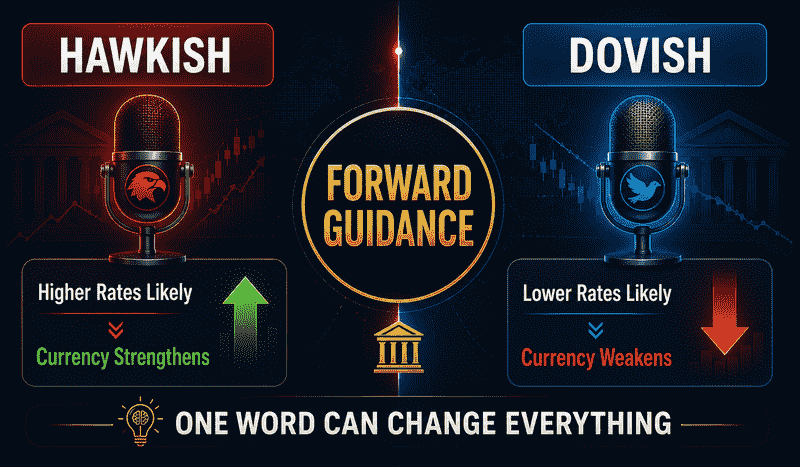
Forward guidance is the communication central banks use to signal their future policy intentions. This is one of the most powerful and subtle aspects of the central banks and forex relationship.
Types of Forward Guidance
Type
Example
Market Impact
Explicit
“We expect to raise rates in 6 months.”
Immediate currency strengthening
Conditional
“We will raise rates if inflation persists.”
Market prices in conditional scenarios
Vague
“We are watching inflation closely.”
The market speculates on high volatility
Dovish
“We see risks to the downside.”
Currency weakens
Hawkish
“We are prepared to act if needed.”
Currency strengthens
🎯 Real-World Example: The Fed’s “Dot Plot”
The Federal Reserve publishes a “dot plot” showing each policymaker’s interest rate expectations.
What It Reveals:
If dots move higher → USD strengthens
If dots move lower → USD weakens
If dots are unchanged → minimal impact
🟦 Blue Highlight: Forward guidance often moves markets more than the actual policy change. A hawkish comment can strengthen a currency weeks before any rate hike actually occurs.
Figure 3: How central bank communication moves forex markets
Way #4: Direct Currency Intervention
Direct intervention is the most aggressive tool in the central banks’ and foreign exchange relationship. Central banks actively buy or sell their own currency in the open market to influence its value.
Types of Direct Intervention
Type
Action
Effect
Sterilized Intervention
Buy/sell currency without changing the money supply
Temporary price impact
Unsterilized Intervention
Buy/sell currency while adjusting money supply
Permanent price impact
Coordinated Intervention
Multiple central banks act together
Stronger, longer-lasting impact
🎯 Real-World Example: Swiss National Bank
The Swiss National Bank is famous for direct intervention in the central banks and forex relationship.
The Scenario:
CHF was too strong, hurting Swiss exports
SNB aggressively bought foreign currencies to weaken the CHF
The Result:
USD/CHF moved from 0.85 to 1.00+ during intervention periods
Traders who followed the SNB’s actions could profit
⚠️ Orange Warning: Direct intervention can create sharp, unpredictable moves. Always use stop losses when trading around intervention scenarios.
Way #5: Verbal Intervention
Verbal intervention is the practice of central bank officials making public statements designed to influence currency values without actually trading.
How Verbal Intervention Works
Statement Type
Market Impact
Example
“We are concerned.”
Traders expect action
Currency moves in the desired direction
“We are watching closely.”
Heightened vigilance
Reduced volatility as traders wait
“We are prepared to act.”
Strongest signal
Immediate market reaction
🎯 Real-World Example: ECB Verbal Intervention
European Central Bank officials are known for using verbal intervention to manage the Euro’s value.
The Scenario:
EUR/USD was trading at 1.20 (too strong for ECB preference)
ECB President stated: “The exchange rate is increasingly important for our policy decisions.”
The Result:
The market interpreted as “weaker EUR wanted”
EUR/USD dropped 50 pips instantly
🟦 Blue Highlight: Words matter as much as actions in the central banks and forex relationship. A single word change in a statement can move markets by 100+ pips.
Figure 4: How to trade around central bank events
Trading Central Bank Events
Understanding central banks and forex is one thing. Trading around central bank events is another. Here is a practical approach:
Step 1: Know the Calendar
Event
Frequency
Impact
Interest Rate Decision
Monthly or Quarterly
Highest impact
Monetary Policy Statement
Same day as rate decision
High impact
Press Conference
30-60 min after the decision
High impact
Meeting Minutes
2-4 weeks after meeting
Moderate impact
Central Bank Speeches
Various
Moderate-to-high impact
Step 2: Understand Market Expectations
Before any central bank event, ask:
What is the consensus forecast?
What is the market pricing in?
What would surprise the market?
Step 3: Prepare Your Strategy
Scenario
Strategy
Hawkish Surprise
Buy the currency
Dovish Surprise
Sell the currency
No Change
Trade the press conference instead
Neutral
Wait for the reaction, then follow the momentum
Step 4: Manage Risk
🟦 Blue Highlight: Central bank events are the highest volatility periods in forex. Always use wider stop-losses to avoid being stopped out by temporary spikes.
Common Mistakes When Trading Central Banks
Mistake
Why It’s a Problem
How to Fix
Trading the rumor
The market already priced it in
Focus on the “surprise.”
Ignoring the press conference
The statement tells half the story
Wait for full communication
No stop-loss
One bad event can wipe you out
Always use SL
Trading too big
Leverage + volatility = disaster
Use smaller position sizes
Chasing the move
Often too late
Wait for a pullback
Figure 5: Central bank trading strategy summary — what every forex trader should know
Conclusion: The Power of Central Banks in Forex
The relationship between central banks and forex is the single most important dynamic in the currency markets. Understanding how central banks think, communicate, and act gives you a powerful edge.
Key Takeaways:
Interest rates are the primary driver—higher rates = stronger currency
Quantitative easing weakens currencies—more money in circulation = less value
Forward guidance moves markets—What central banks say matters as much as what they do
Direct intervention can be powerful—but it’s often temporary
Verbal intervention is common—words can move prices
🎯 Final Thought: The most successful traders don’t just react to central bank announcements—they anticipate them. By understanding central banks and forex, you can position yourself ahead of major moves rather than chasing them after they happen.
FAQ
1. Which central bank has the biggest impact on forex?
The US Federal Reserve has the largest impact because the US Dollar is the world’s primary reserve currency and is involved in over 80% of all forex transactions.
3. What is forward guidance, and why does it matter?
Forward guidance is central bank communication about future policy intentions. It matters because traders react to expectations, often moving markets before the actual policy change.
4. Can central banks control currency values?
Central banks can influence currency values through interest rates, QE, and direct intervention. However, they cannot control them completely—market forces are ultimately the final arbiters.
5. What is the difference between hawkish and dovish?
Hawkish means favoring higher interest rates to control inflation (strengthens currency). Dovish means favoring lower rates to stimulate growth (weakens currency).
6. When should I trade around central bank events?
Trade around high-impact events like interest rate decisions and press conferences. Avoid trading immediately before announcements, as volatility can be extreme.
7. What is the safest way to trade central bank events?
Use smaller position sizes and wider stop-losses, and wait for the initial volatility spike to settle before entering. Focus on the press conference, not just the rate decision.
Further Reading
To deepen your understanding of forex trading, we recommend exploring these additional resources from Finwirestack:
Disclaimer: Trading forex and CFDs involves significant risk of loss. It is not suitable for all investors. You should carefully consider your investment objectives, level of experience, and risk appetite before trading. Never trade with money you cannot afford to lose. The information provided in this article is for educational purposes only and does not constitute financial advice.
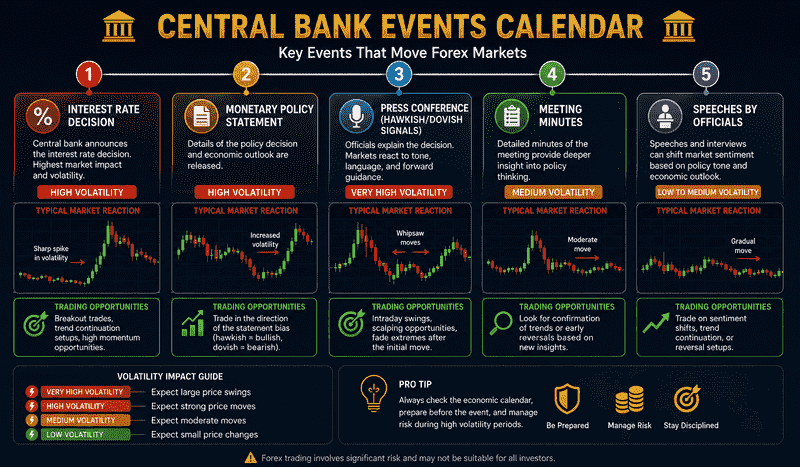
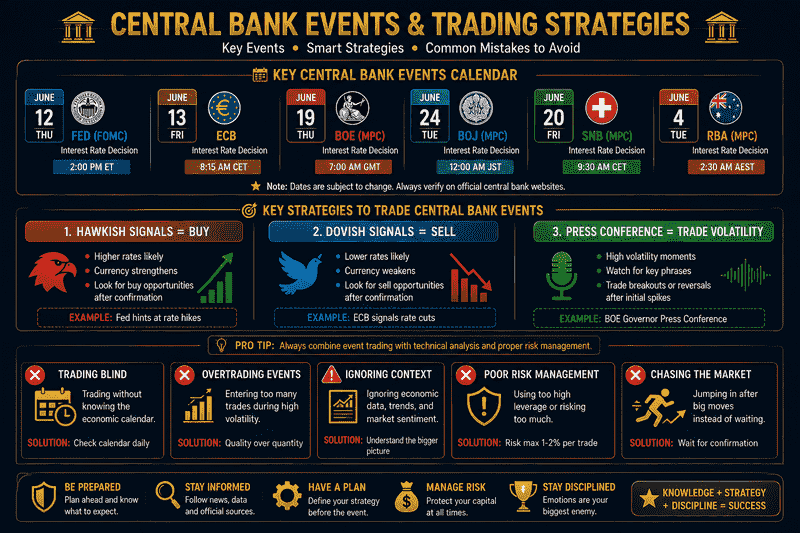
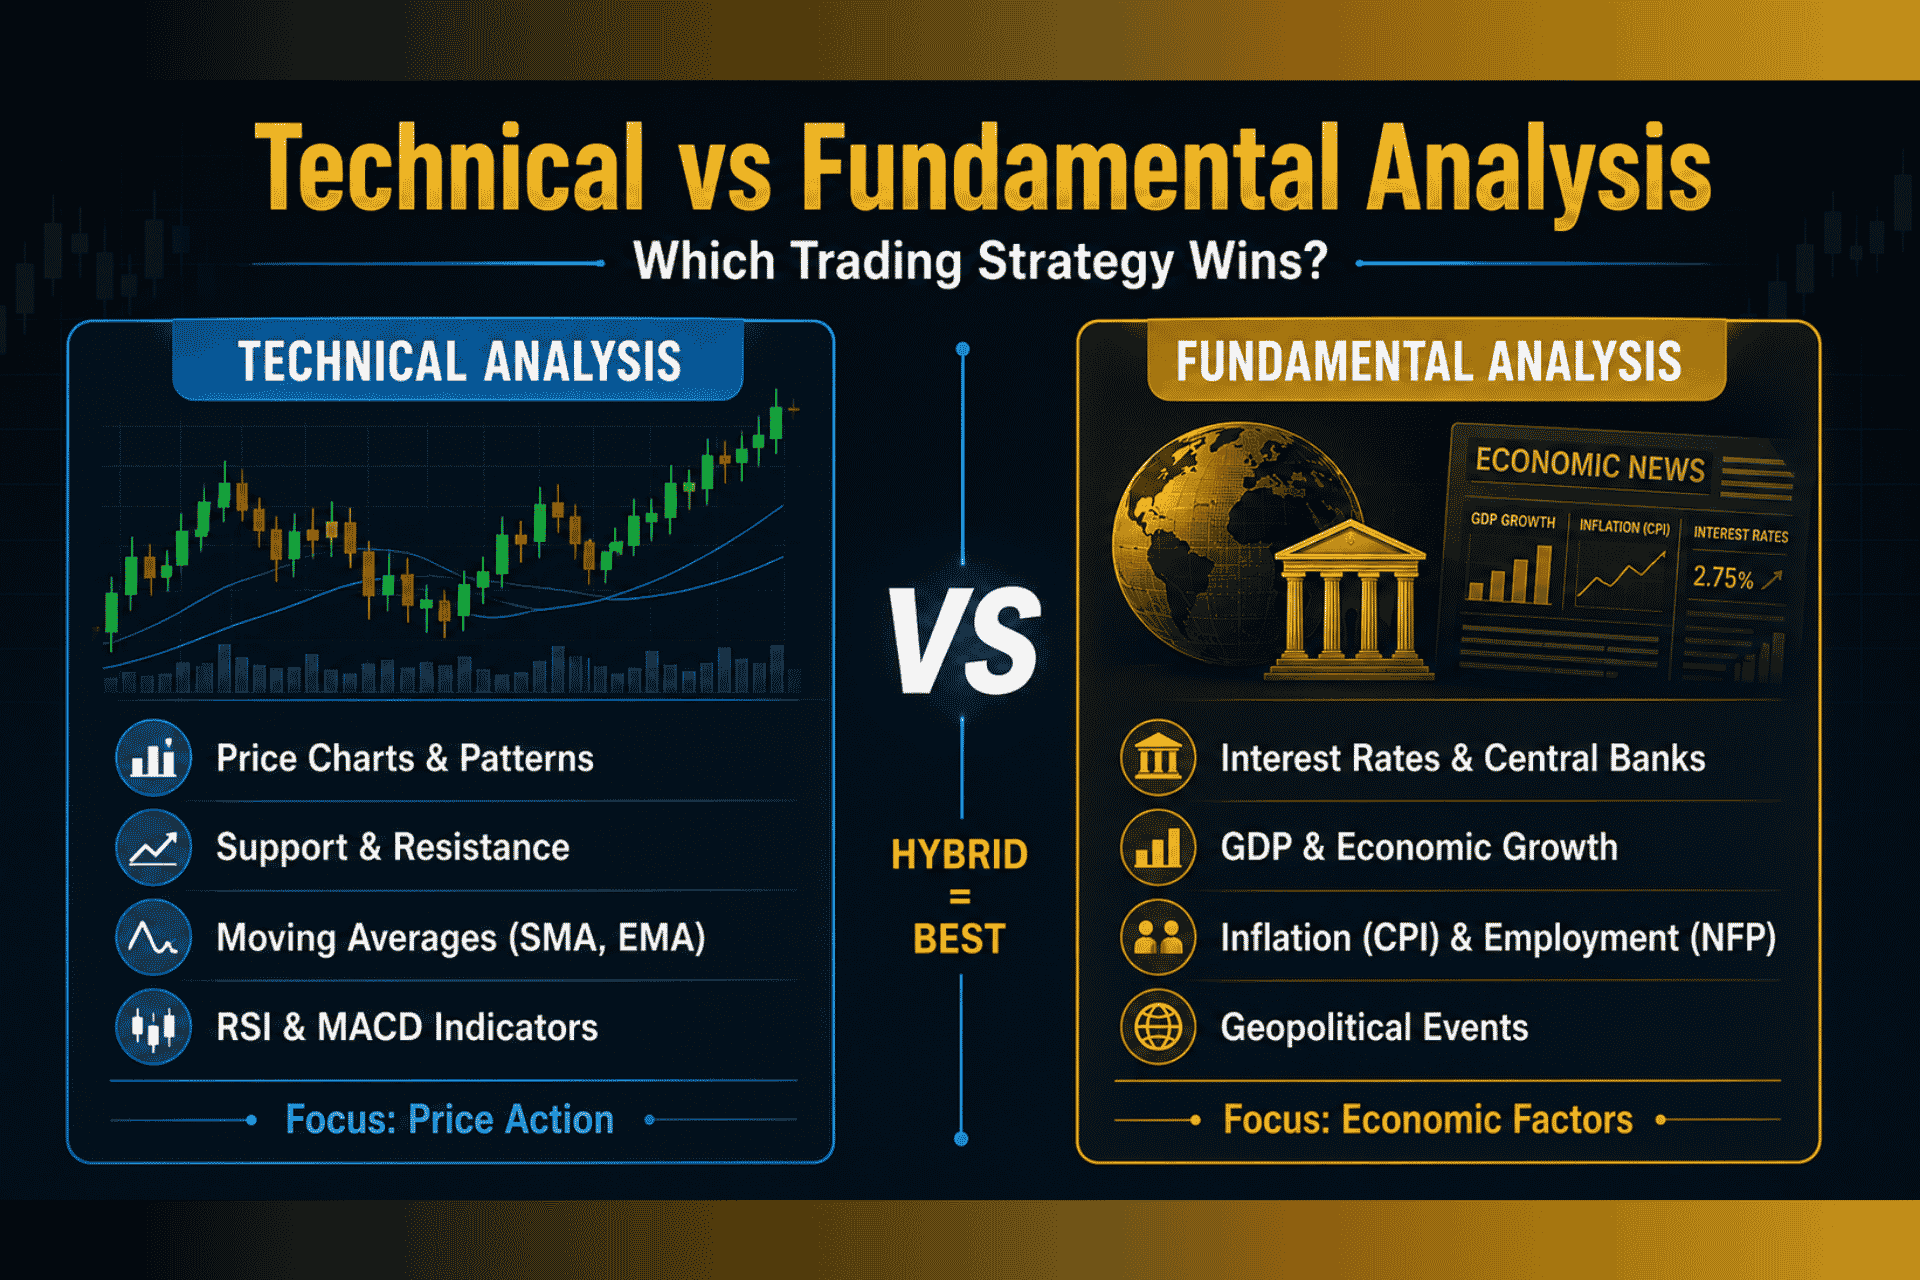
Technical vs fundamental analysis is one of the oldest debates in trading. Walk into any trading room, and you will find passionate advocates on both sides. Technical traders stare at charts, believing all market information is reflected in price. Fundamental traders study economic data, convinced that currency values are driven by interest rates, inflation, and growth.
But here’s the truth: technical vs fundamental analysis isn’t about choosing a winner. It’s about understanding which approach fits your personality, time horizon, and trading goals.
This guide breaks down both technical vs fundamental analysis methods with real examples, clear comparisons, and practical advice. You will learn:
What each approach actually involves
The pros and cons of each method
Which approach suits different trading styles
How professionals combine both for better results
By the end, you will understand technical vs fundamental analysis well enough to decide which path—or combination—is right for you.
What is technical analysis?
Technical analysis is the study of price action and market behavior using charts and indicators. It operates on three core assumptions:
Market discounts everything—all known information (economic, political, psychological) is already reflected in the price.
Price moves in trends — Once a trend is established, it tends to continue until it reverses.
History repeats itself—market patterns and trader behavior repeat over time.
Technical traders don’t care why the price moved. They care about what the price is doing right now and what it might do next based on historical patterns.
Key Tools for Technical Analysis
1. Price Charts (Candlestick, Line, Bar)
The foundation of technical vs fundamental analysis when using charts. Candlestick charts show open, high, low, and close prices for each time period.
🎯 Real-World Analogy: A candlestick chart is like a weather map. It shows what happened (rain or sun) but doesn’t tell you why. You just use it to predict tomorrow’s weather.
2. Support and Resistance
Support: A price level where buying pressure is strong enough to prevent further declines.
Resistance: A price level where selling pressure is strong enough to prevent further rises.
3. Moving Averages (SMA, EMA)
SMA (Simple Moving Average): Average price over a specific number of periods.
EMA (Exponential Moving Average): Gives more weight to recent prices, reacting faster to changes.
4. RSI (Relative Strength Index)
A momentum oscillator measuring the speed of price changes:
Above 70: Overbought (potential decline)
Below 30: Oversold (potential rise)
5. MACD (Moving Average Convergence Divergence)
Shows the relationship between two moving averages to identify momentum shifts.
6. Candlestick Patterns
Specific formations suggesting reversals or continuations:
Doji: Indecision
Hammer: Bullish reversal
Engulfing Pattern: Major shift in momentum
Shooting Star: Bearish reversal
📊 Table: Technical Analysis Tools Summary
Tool
Purpose
Signal
Support/Resistance
Identify price levels
Breakout or bounce
Moving Averages
Determine trend direction
Crossovers signal entries
RSI
Measure momentum
Overbought/oversold conditions
MACD
Identify momentum shifts
Crossover of signal line
Candlestick Patterns
Predict reversals
Specific pattern formations
What is fundamental analysis?
Fundamental analysis examines the economic, financial, and political factors that drive currency values. It assumes that currencies have intrinsic values based on the health of their underlying economies.
Fundamental traders ask: “What is happening in this country’s economy, and how will that affect its currency?”
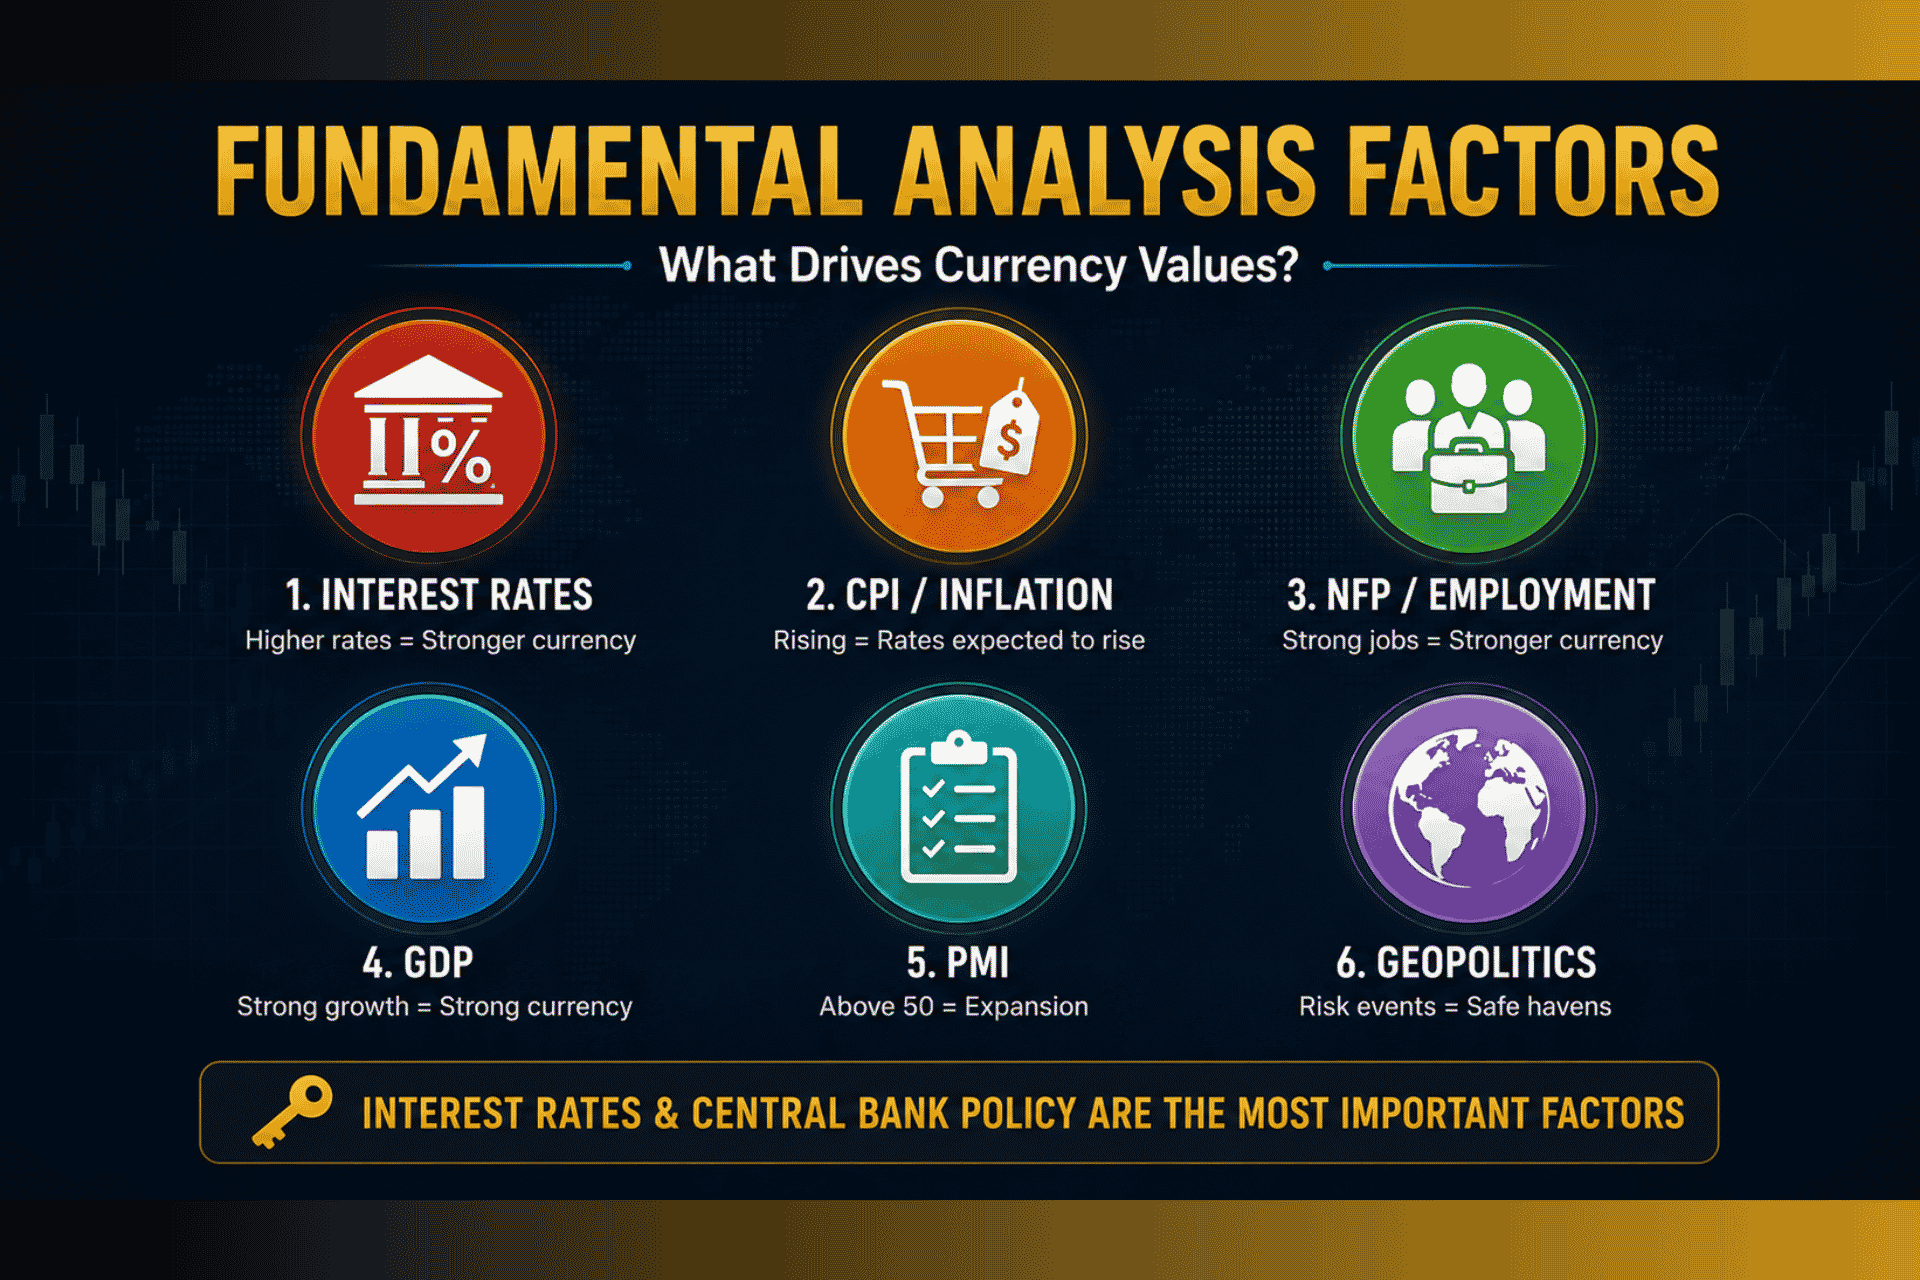
Key Factors in Fundamental Analysis
1. Interest Rates and Central Bank Policy
The most important driver of currency values. Higher interest rates attract foreign investment, strengthening the currency.
🎯 Real-World Analogy: Think of interest rates like the “price of money.” When the price is high, everyone wants to “buy” that currency to get a better return. When the price is low, demand drops.
2. Inflation (CPI)
Rising inflation: May force central banks to raise rates (strengthens currency)
Falling inflation: May lead to rate cuts (weakens currency)
3. Employment Data (NFP)
US Non-farm Payrolls is the biggest monthly event for USD pairs. Strong employment = stronger currency.
4. GDP (Gross Domestic Product)
Measures economic growth. Strong GDP = strong currency.
5. PMI (Purchasing Managers’ Index)
Survey-based indicator of economic health:
Above 50: Expansion
Below 50: Contraction
6. Geopolitical Events
Wars, elections, trade disputes, and political instability impact currency values.
📊 Table: Fundamental Analysis Factors
Factor
What It Measures
Currency Impact
Interest Rates
Cost of borrowing
Higher rates = stronger currency
CPI/Inflation
Price growth
Rising inflation = rates expected to rise
NFP/Employment
Labor market health
Strong jobs = stronger currency
GDP
Economic growth
Strong growth = stronger currency
PMI
Business sentiment
Above 50 = expansion (strengthens currency)
Geopolitics
Stability/risk
Risk events = safe-haven flows
Technical vs Fundamental Analysis: The Key Differences
Understanding technical vs fundamental analysis means recognizing their fundamental differences:
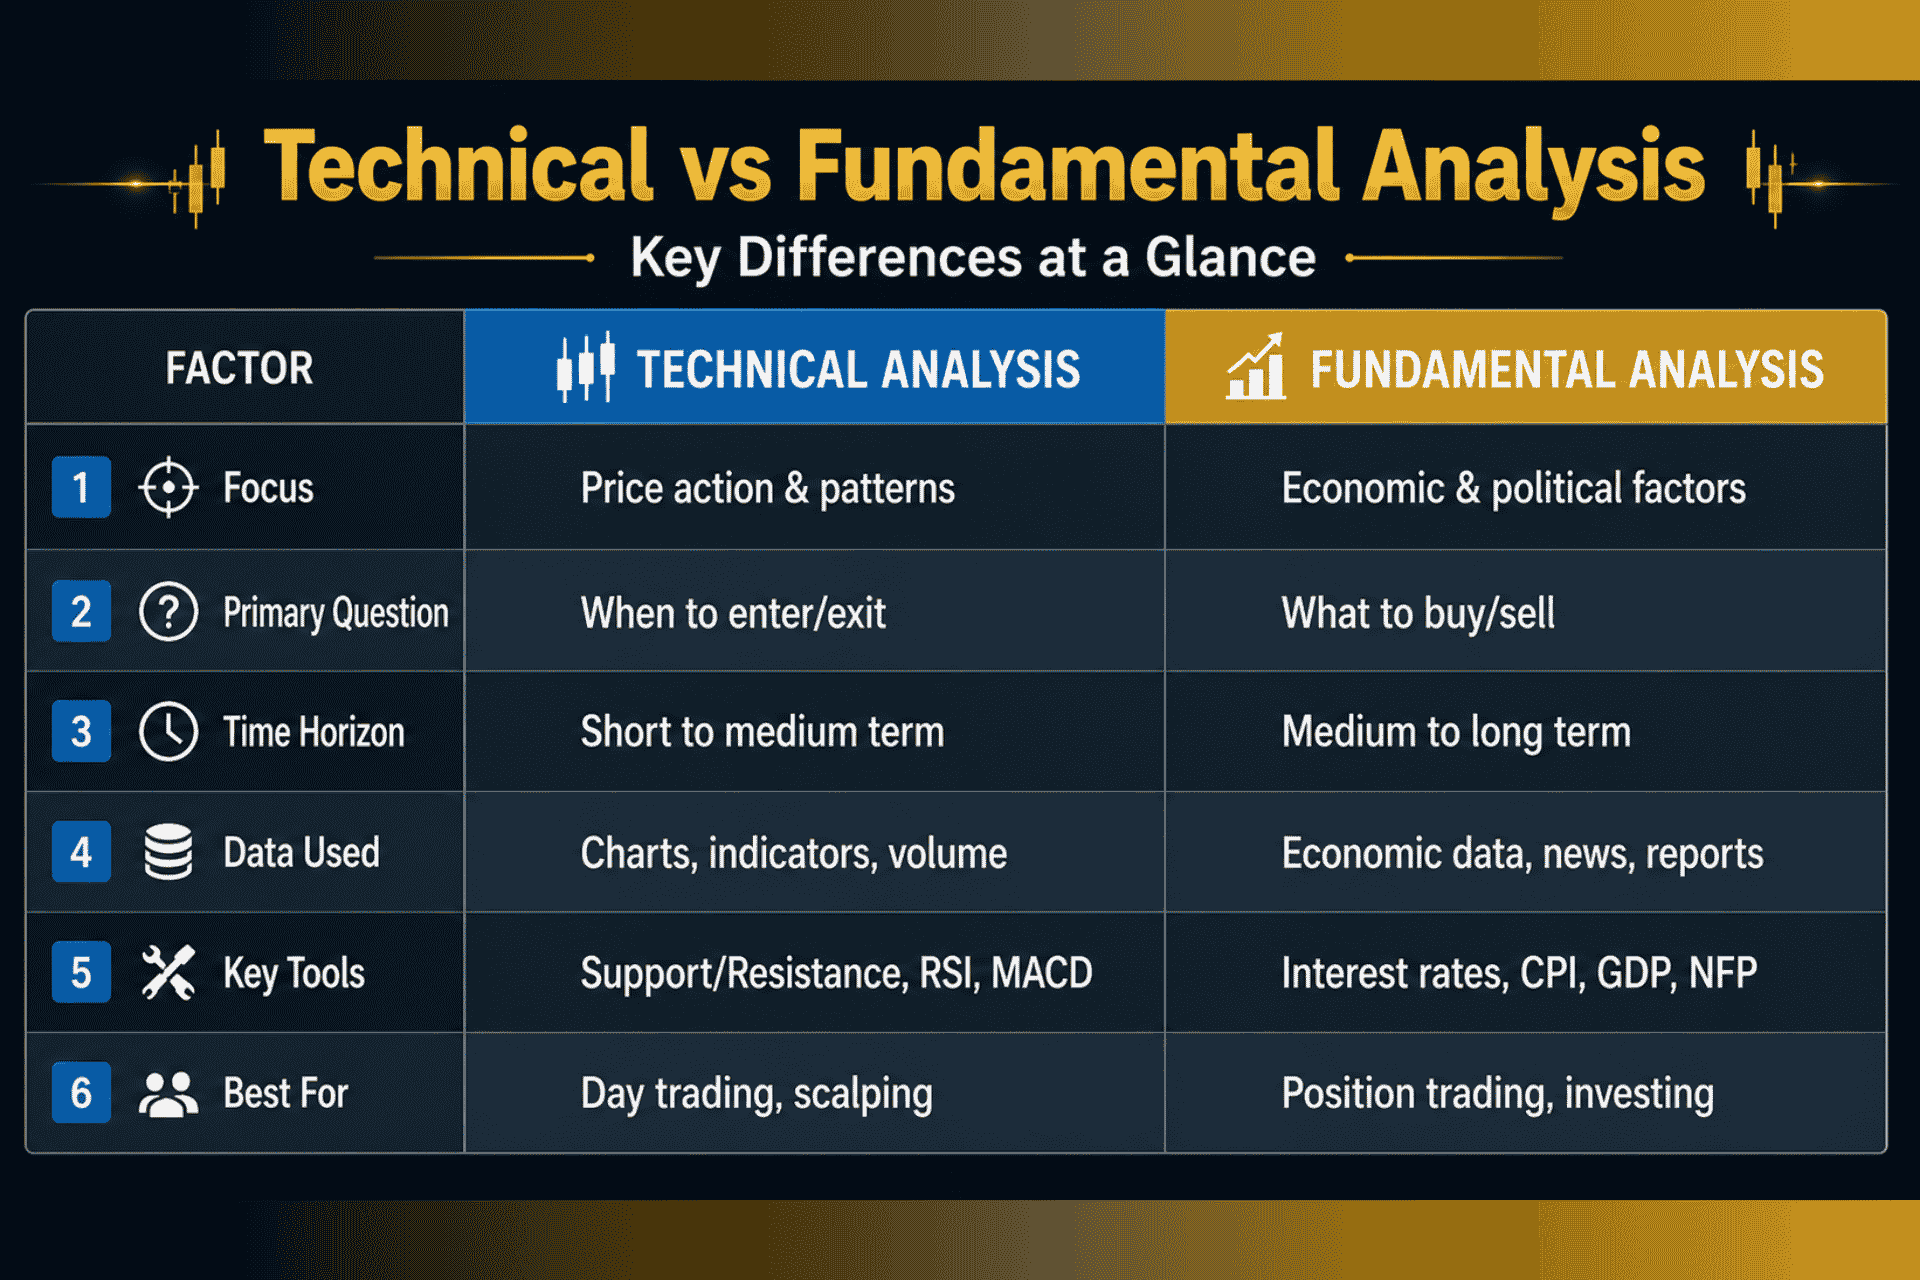
📊 Table: Technical vs Fundamental Analysis Comparison
Factor
Technical Analysis
Fundamental Analysis
Focus
Price action and patterns
Economic and political factors
Primary Question
When to enter/exit
What to buy/sell
Time Horizon
Short to medium term
Medium to long term
Data Used
Charts, indicators, volume
Economic data, news, reports
Key Tools
Support/resistance, RSI, MACD, moving averages
Interest rates, CPI, GDP, NFP, central bank policy
Approach
Price discounts everything
Price may not reflect true value
Decision Making
Pattern recognition
Economic analysis
Best For
Day trading, scalping, swing trading
Position trading, long-term investing
🧮 Real Example: Technical vs Fundamental Analysis in Action
Let’s look at how technical vs fundamental analysis would approach the same trade differently.
Scenario: EUR/USD is trading at 1.1050.
Technical Analysis View:
The price is approaching a resistance level at 1.1100 (price has been rejected here three times)
RSI is at 72 (overbought)
A shooting star candlestick pattern formed yesterday
Technical Decision: Wait for a confirmed breakout above 1.1100, or short with a stop-loss above resistance.
Fundamental Analysis View:
ECB is expected to cut interest rates next week (bearish for EUR)
US Non-Farm Payrolls came in stronger than expected (bullish for USD)
Eurozone inflation is falling (bearish for EUR)
Fundamental Decision: Short EUR/USD in anticipation of a rate cut.
Which Approach is Better?
The answer to technical vs fundamental analysis depends on who you are, not just what the market does.
When Technical Analysis Excels
Scenario
Why Technical Works
Short-term trading
Price patterns matter more than long-term fundamentals
Holding for weeks or months requires fundamental conviction
📊 Table: Which Approach Fits Your Personality?
Your Personality
Best Analysis Approach
Detail-oriented, patient, enjoys research
Fundamental Analysis
Decisive, quick-thinking, loves patterns
Technical Analysis
Dislikes complex economics
Technical Analysis
Wants to understand “why”
Fundamental Analysis
Has limited trading time
Technical Analysis
Enjoys following news and data
Fundamental Analysis
Likes seeing immediate results
Technical Analysis
Thinks long-term
Fundamental Analysis
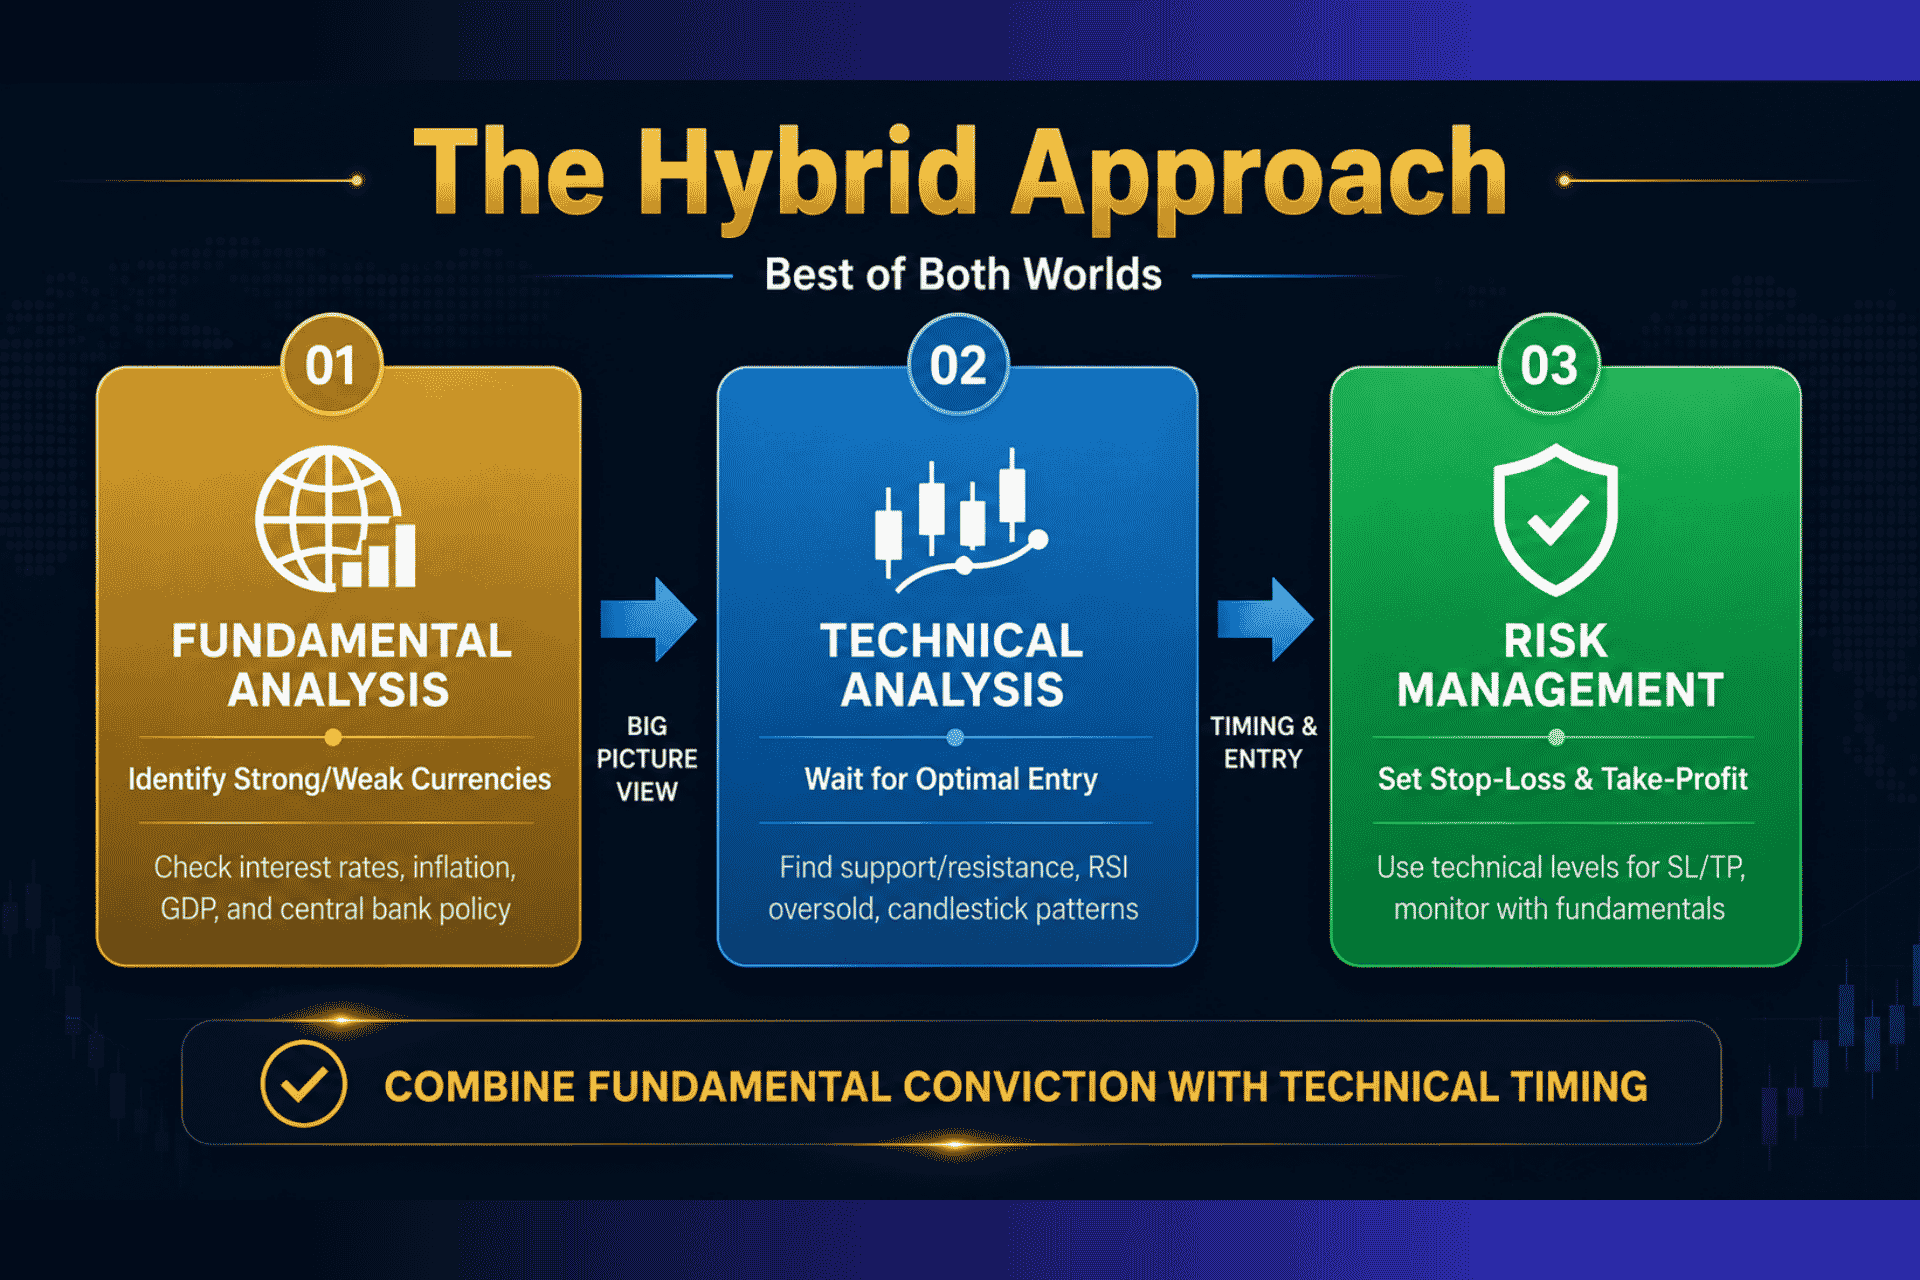
The Hybrid Approach: Best of Both Worlds
Most successful traders use a hybrid approach, combining technical vs fundamental analysis rather than choosing one.
How Professionals Combine Both
Fundamental analysis to identify the trend
Which currencies are fundamentally strong/weak?
Which central banks are hawkish/dovish?
What is the overall economic outlook?
Technical analysis to time the entry
Where are support and resistance levels?
What do indicators say about momentum?
Where is the best risk/reward entry point?
🎯 Real-World Hybrid Example
Scenario: You believe the US Dollar will strengthen based on fundamentals (strong NFP data, hawkish Fed). You want to trade USD/JPY.
Fundamental Step: Confirm the USD is fundamentally strong relative to JPY (BoJ remains dovish). This is your “big picture” view.
Technical Step: Wait for:
Price to pull back to a support level
RSI to drop below 30 (oversold)
A bullish candlestick pattern to confirm entry
Decision: You buy USD/JPY at 145.00 with a stop-loss below support at 144.50. Your fundamental view gives you conviction; your technical tools give you an entry.
📊 Table: Hybrid Strategy Workflow
Step
Action
Tool Used
1
Identify strong/weak currencies
Fundamental Analysis
2
Determine overall trend
Fundamental + Technical
3
Wait for optimal entry
Technical Analysis
4
Set stop-loss and take-profit
Technical Analysis (support/resistance)
5
Monitor trade
Technical Analysis
6
Exit based on news or target
Fundamental + Technical
Which Approach Should Beginners Start With?
For new traders learning technical vs fundamental analysis, the best answer is:
Start with Technical Analysis
Reason 1: Technical analysis has a shorter learning curve. You can learn the basics of support/resistance, moving averages, and candlestick patterns in a few weeks.
Reason 2: It gives you immediate feedback. You place a trade, you see the result. This helps you learn faster.
Reason 3: It works for shorter timeframes. Beginners often start with day trading or swing trading, where technical analysis is more relevant.
Add Fundamental Analysis Gradually
Reason 1: Understanding economics takes time. It’s not something you master overnight.
Reason 2: Fundamentals matter for position trading. As you hold trades longer, economic factors become more important.
Reason 3: It helps you avoid trading against central banks. Knowing what the Fed, ECB, or BoJ is planning can save you from costly mistakes.
Common Mistakes in Both Approaches
Technical Analysis Mistakes
Mistake
Why It’s a Problem
How to Fix
Using too many indicators
Analysis paralysis
Stick to 2-3 core indicators
Ignoring the big picture
Missing major trends
Check weekly/monthly charts
Over-optimizing
Curve fitting
Test strategies on different timeframes
Ignoring fundamentals
Trading against central banks
Check the economic calendar
Fundamental Analysis Mistakes
Mistake
Why It’s a Problem
How to Fix
Trading news too aggressively
Market reactions are unpredictable
Wait for confirmation
Ignoring technical levels
Poor entries and exits
Use technicals for timing
Outdated information
Markets react quickly
Use real-time data
Confirmation bias
Only seeing what you want to see
Consider contrary opinions
📊 Comparison Table: Technical vs Fundamental Analysis
Factor
Technical Analysis
Fundamental Analysis
Best Timeframe
Short-term (minutes to weeks)
Long-term (weeks to months)
Learning Curve
Moderate
Steep
Data Availability
Immediate (real-time charts)
Delayed (economic reports)
Objectivity
High (clear signals)
Low (subjective interpretation)
Market Awareness
Price-focused
Economics-focused
Risk Management
Clear (stop-loss levels)
Subjective (economic changes)
Conclusion
The debate of technical vs fundamental analysis doesn’t have a single winner—and it shouldn’t. Both approaches have strengths and weaknesses.
Technical Analysis is best for:
Short-term trading
Entering and exiting positions
Managing risk with clear levels
Fundamental Analysis is best for:
Long-term trends
Understanding why markets move
Trading around major events
The Hybrid Approach is best for
Professional traders
Position traders
Anyone who wants a complete picture
For Beginners: Start with technical analysis. It’s more accessible and gives immediate feedback. Add fundamental analysis gradually as you gain experience and start holding trades for longer periods.
The key is not to ask “which is better?” but “which is better for me?”
FAQ
1. Which is better, technical or fundamental analysis?
Neither is universally better. Technical analysis excels at timing entries and exits for short-term trades. Fundamental analysis is better for identifying long-term trends and understanding why markets move. The best approach depends on your trading style, time horizon, and personality.
2. Can I use both technical and fundamental analysis?
Yes! Most professional traders use a hybrid approach. Use fundamental analysis to identify which currencies are fundamentally strong/weak, then use technical analysis to time your entries and exits with good risk/reward ratios.
3. Which analysis method is easier for beginners?
Technical analysis typically has a shorter learning curve. You can learn the basics of support, resistance, moving averages, and candlestick patterns relatively quickly. Fundamental analysis requires understanding economics, which takes longer to master.
4. Does technical analysis work in forex?
Yes, technical analysis works well in forex because the forex market is highly liquid and moves in identifiable trends and patterns. Major currency pairs like EUR/USD and GBP/USD have enough volume to make technical levels meaningful.
5. What is the most important factor in fundamental analysis?
Interest rates and central bank policy are the most powerful drivers of currency values. Rate differentials between countries determine carry trade flows and long-term currency direction.
6. How long does it take to learn technical analysis?
The basics can be learned in 2-4 weeks of consistent study. However, mastering technical analysis and developing consistent profitability takes months or years of practice. Start simple, master a few tools, and expand gradually.
7. Do professional traders use fundamental or technical analysis?
Most professionals use a combination of both. Hedge funds, banks, and institutional traders have dedicated analysts for fundamental research and technical traders for execution. The hybrid approach is the industry standard.
Further Reading
To deepen your understanding of forex trading, we recommend exploring these additional resources from Finwirestack:
Disclaimer: Trading forex and CFDs involves significant risk of loss. It is not suitable for all investors. You should carefully consider your investment objectives, level of experience, and risk appetite before trading. Never trade with money you cannot afford to lose. The information provided in this article is for educational purposes only and does not constitute financial advice.
How to start trading forex is one of the most common questions asked by people entering the financial markets. The foreign exchange market is the largest financial market in the world, with daily trading volumes reaching approximately $7.5 trillion, according to the Bank for International Settlements. That scale is why major currency pairs are highly liquid and usually carry tight spreads.
But size alone doesn’t explain how to start trading forex. The reality is that jumping into trading without a structured approach is a recipe for disaster. Many beginners open an account, deposit money, and immediately start losing because they skipped the essential preparation steps.
This guide is different. It walks you through exactly how to start tradingforex—from understanding the basics to choosing a broker, opening an account, practicing on a demo, and placing your first real trade. Every step includes real examples, calculations, and practical advice to help you avoid the common mistakes that wipe out beginner accounts.
What is forex trading?
Before learning how to start trading forex, you need to understand what forex trading actually is.
Forex trading is the buying and selling of currencies in pairs to profit from changes in their exchange rates. When you trade EUR/USD, you buy one currency while selling the other at the same time. Every trade is a view on how two economies move relative to each other.
🎯 Real-World Analogy: Imagine you’re traveling to Europe. You exchange US Dollars for Euros at an airport currency booth. If the exchange rate is 1.10, you get 1.10 Euros for every Dollar. Forex trading is like doing this on a massive scale—but instead of traveling, you’re speculating on whether the exchange rate will go up or down.
Key facts to know before learning how to start trading forex:
Fact
Detail
Market Size
$7.5 trillion+ daily volume
Trading Hours
24 hours, 5 days a week
Market Type
Decentralized (Over-the-Counter)
Main Participants
Banks, hedge funds, corporations, and retail traders
Popular Pairs
EUR/USD, GBP/USD, USD/JPY
Step 1: Learn the Essential Forex Terminology
Before you can learn how to start trading forex, you must understand the five terms that drive every trade:
Currency Pair — Two currencies quoted together. The first is the base currency; the second is the quote currency.
Pip — The smallest standard price move (the fourth decimal for most pairs).
Lot — The trade size (a micro lot is 1,000 units).
Leverage — Borrowed capital that lets you control a larger position with less money.
Margin — The deposit required to open a leveraged position.
🟦 Blue Highlight: Understanding these terms means you can read a quote and calculate profit, loss, and risk before you click “buy” or “sell.”
Step 2: Choose a Regulated Broker
Your broker decides your trading conditions, so regulation matters most. A regulated broker must follow strict standards around transparency, fair dealing, and the segregation of client funds.
📊 Table: What to Look For in a Broker
Factor
Why It Matters
What to Check
Regulation
Protects your funds
FCA, ASIC, CySEC, NFA license
Spreads & Fees
Affects your costs
Tight spreads, transparent fees
Execution
Price accuracy
Fast, reliable execution
Platform
Your trading interface
MT4, MT5, or proprietary platform
Education
Helps you learn
Webinars, articles, tutorials
Support
Help when needed
24/5 multilingual support
Why Regulation is Critical
Protection of Funds—Regulated brokers must keep client funds in separate accounts from their business operations.
Fair Trading Environment — Regulations prevent brokers from manipulating prices or failing to execute trades promptly.
Transparency—Regulatory bodies require regular financial audits and disclosures.
How to Verify a Broker’s Regulation
Check the broker’s website for license numbers.
Cross-check on official regulatory websites like the FCA, ASIC, or CySEC.
🔴 Red Highlight: Trading with an unregulated broker exposes you to counterparty risk. If they go bankrupt or engage in fraud, your funds are not protected. This is one of the most important lessons in learning how to start trading forex.
Step 3: Open and Verify a Trading Account
Opening an account follows three stages before you trade forex:
Register your details — Provide your name, email, phone number, and address.
Complete identity verification (KYC) — Upload a government-issued ID and proof of residence. This is a regulatory requirement that protects both you and the broker.
Choose an account type—Select between a standard account (commission-free with wider spreads) or a RAW account (tighter spreads with a commission).
Minimum Deposit: Many brokers allow you to open an account from as little as USD 100. Some let you start even lower. A larger balance leaves more room to manage trades effectively.
Step 4: Practice on a Demo Account
A demo account lets you place trades with virtual funds under live market conditions. Use it to learn the platform, test how orders work, and see how price movement affects a position—without risking real money.
What to Practice on a Demo Account
Practice Area
Why It’s Important
Placing Orders
Learn market vs limit orders
Setting Stop-Losses
Practice risk management
Reading Charts
Understand price action
Calculating Pips
Know your profit/loss
Testing Strategies
Build confidence
Understanding Margin
See how leverage works
Common Demo Mistakes to Avoid
Practicing with an unrealistic virtual balance—Using $100,000 when you only plan to deposit $1,000 undermines your understanding of risk.
Over-leveraging — Because there is no real money risk, traders tend to max out leverage. High leverage amplifies losses, not just profits.
Ignoring spread and swap costs—Swing traders often forget about overnight fees that affect long-term positions.
Practicing only in calm market conditions—Trading only during quiet hours creates a false sense of security.
🟦 Blue Highlight: Before you start trading forex live, stay on demo until you can open, set a stop-loss, and close a trade without hesitation. Treat it as a rehearsal, not a game. Habits formed here carry into live trading.
When to Switch from Demo to Live
Use this checklist to decide if you are ready:
✅ Consistent profitability — Achieved over 30 to 60 days of practice
✅ Risk management — Can maintain stop-losses without revenge trading
✅ Session definition — Committed to trading during tested sessions
✅ Starting small—Ready to trade with micro-lots (0.01)
Step 5: Create a Simple Trading Plan
Before you start trading forex, a trading plan is a written set of rules that defines how you approach the market before you enter a trade. It replaces impulse with structure, which is what keeps beginners consistent.
What a Beginner’s Trading Plan Should Cover
Element
Example
Goal
“Grow account by 5% monthly.”
Time Commitment
“2 hours daily, London session”
Risk Per Trade
“1% maximum”
Entry Conditions
“Buy when the price breaks above the 50-day MA.”
Risk/Reward
“Minimum 1:2”
Review Process
“Weekly journal review”
🎯 Real-World Analogy: A trading plan is like a pilot’s pre-flight checklist. You don’t take off without checking everything first. Following a plan reduces stress and helps you learn from your mistakes.
Step 6: Choose Your First Currency Pair
For a first trade, pick a liquid major pair such as EUR/USD. Majors offer:
High liquidity (tight spreads)
Lower volatility than exotic pairs
More news and analysis available
Lower trading costs
📊 Table: Best Currency Pairs for Beginners
Pair
Nickname
Typical Spread
Why It’s Good for Beginners
EUR/USD
Fiber
0.1-0.5 pips
Highest liquidity, tightest spreads
GBP/USD
Cable
0.3-1.0 pips
High liquidity, clear trends
USD/JPY
Gopher
0.2-0.7 pips
Active during the Asian session
Step 7: Analyze the Market
There are two main types of analysis used in forex:
Technical Analysis
The study of past prices and patterns to predict future price movements. Common tools before one starts trading forex include:
Moving averages (SMA, EMA)
RSI (Relative Strength Index)
Support and resistance levels
Candlestick patterns
Fundamental Analysis
The study of factors that drive currency valuation. Key factors include:
Interest rates and rate differentials
Inflation (CPI)
Employment data (NFP)
GDP growth
Central bank policies
💡 Pro Tip: Beginners often start with technical analysis because it focuses on what you can see on the chart. As you learn trading forex, you can incorporate fundamental analysis to understand why the market moves.
Step 8: Decide to Buy or Sell
Based on your analysis, decide whether to go long (buy) or short (sell).
Buy (Long): You expect the base currency to rise against the quote currency.
Sell (Short): You expect the base currency to fall against the quote currency.
🎯 Real-World Example
If you believe the Euro will strengthen against the US Dollar:
You buy EUR/USD at 1.1050
If the price rises to 1.1070, you make a 20-pip profit
If the price falls to 1.1030, you lose 20 pips
Step 9: Set Stop-Loss and Take-Profit Orders
Risk management is what keeps you in the game long enough to improve.
Stop-Loss (SL)
A pre-set order to close a trade at a specific price to cap your loss.
🟦 Blue Highlight: Never enter a trade without a stop-loss. This is the single most important rule in learning how to start trading forex.
Take-Profit (TP)
A pre-set order to close a trade at a specific price to lock in your gains.
🧮 Risk Calculation Example
Scenario: You have a $5,000 account. You risk 1% per trade. Your stop-loss is 30 pips on EUR/USD trading a micro lot (0.01).
Step 1: Calculate risk in dollars
1% of $5,000 = **$50** risk
Step 2: Calculate pip value for micro lot
1 micro lot = 1,000 units
Pip value = $0.10 per pip
Step 3: Calculate maximum pips to risk
$50 risk ÷ $0.10 = 500 pips
✅ Result: With a micro lot, a 30-pip stop-loss risks just $3. This is why micro lots are perfect for beginners.
📊 Table: Stop-Loss Placement Guide
Lot Size
Pip Value
30-Pip Risk
50-Pip Risk
100-Pip Risk
Micro (0.01)
$0.10
$3.00
$5.00
$10.00
Mini (0.1)
$1.00
$30.00
$50.00
$100.00
Standard (1.0)
$10.00
$300.00
$500.00
$1,000.00
🟦 Blue Highlight: Starting with micro lots keeps risk manageable while learning. This is a key lesson in how to start trading forex.
Step 10: Place Your First Trade
Now you’re ready to place your first real trade.
Step-by-Step Trade Execution
Log in to your trading platform (MT4, MT5, or proprietary).
Select your currency pair—For your first trade, choose a major pair.
Decide your direction—buy or sell based on your analysis.
Choose your order type—market order (immediate) or limit order (specific price).
Set your position size—Use a micro lot (0.01) for your first trade.
Set stop-loss and take-profit—Define your risk and reward before confirming.
Confirm the trade—Review all details and click “Buy” or “Sell.”
Monitor your position—Watch the trade but avoid overmanaging.
🎯 First Trade Example
Scenario: You are ready for your first live trade.
Account: $1,000
Pair: EUR/USD
Position: Micro lot (0.01)
Entry: Buy at 1.1050
Stop-Loss: 1.1020 (30 pips risk)
Take-Profit: 1.1080 (30 pips reward)
Risk: $3.00 (1 micro lot × 30 pips × $0.10)
Result scenarios:
Profit: Price hits 1.1080 → +$3.00
Loss: Price hits 1.1020 → -$3.00
🟩 Green Highlight: The first live order is the one most people remember. Keeping the size small is what makes it possible to press the button at all—and to learn from the result rather than dwell on it.
Step 11: Monitor and Close Your Trade
Once you’ve opened a position, monitor it in the “open positions” section of your trading platform.
What to Monitor
Floating P&L — Your unrealized profit or loss
Market news — Economic events that could impact your trade
Technical levels — Support and resistance that could signal a reversal
When to Close
If TP is hit, your trade closes automatically — take your profit.
If SL is hit, your trade closes automatically — accept the loss.
If neither is hit, you can close manually when conditions change.
Step 12: Keep a Trading Journal
A trading journal is the #1 tool for improving as a trader. Record every trade with:
Currency pair traded
Entry and exit prices
Reason for the trade
Profit/loss amount
Emotional state during the trade
Lessons learned
Why a Journal Matters
A journal turns random trades into a learning loop. Without records, you repeat the same mistakes. With a journal, you can see patterns in your decision-making and improve systematically in this journey before you start trading forex.
Common Beginner Mistakes to Avoid
Most early losses come from avoidable behavior, not from poor analysis.
Mistake
Why It’s Dangerous
How to Avoid It
Over-leveraging
Magnifies losses
Use 1:5 to 1:10 maximum
Trading without stop-loss
A single bad move can wipe out an account
Always set SL before entry
Risking too much per trade
One loss is decisive
Risk 1-2% maximum
Revenge trading
Chasing losses deepens them
Step away after a loss
Skipping demo stage
Costly platform errors
Practice until confident
No trading journal
Repeat the same mistakes
Record every trade
🔴 Red Highlight: The pattern we see most often is a beginner taking a small loss, feeling they have to win it back straight away, and doubling the next position—turning a minor setback into a real problem.
Forex Trading Sessions
The forex market runs 24 hours a day, five days a week, but activity is not constant. Liquidity and volatility rise and fall as the major financial centers open and close.
📊 Table: Forex Trading Sessions
Session
Approx. Hours (GMT)
Characteristics
Asia (Tokyo)
00:00 – 09:00
Calmer, lower volatility
Europe (London)
08:00 – 17:00
Liquidity rises, spreads tighten
North America (New York)
13:00 – 22:00
Active, sensitive to US data
London–New York Overlap
13:00 – 17:00
Most active, highest volume
💡 Pro Tip: The London–New York overlap is the busiest window—the most active time for price movements. This is when beginners should practice trading forex.
How Much Money Do You Need to Start?
The amount depends on the broker, but here are the general guidelines:
Account Type
Minimum Deposit
Recommended for Beginners?
Micro Account
$50 – $100
✅ Best for beginners
Mini Account
$100 – $500
✅ Good with experience
Standard Account
$500+
⚠️ Higher risk while learning
RAW/ECN Account
$1,000+
❌ Not recommended for beginners
🟦 Blue Highlight: Some brokers let you open an account from as little as USD 100 and trade micro lots (0.01), so you can start small while trading forex. A larger balance leaves more room to manage trades effectively.
FAQ
1. How do I start trading forex for beginners?
Before you start trading forex, learn how currency pairs and pips work, open an account with a regulated broker, and practice on a demo account. Then create a simple trading plan, place a small first trade with a stop-loss, and review each trade to refine your approach.
2. Is forex trading good for beginners?
Forex can suit beginners who focus on education and risk management first. The market is accessible and liquid, but leverage and volatility mean you should learn and practice before risking real capital on your journey to start trading forex.
3. How much money do I need to start forex trading?
It depends on the broker. Some let you open an account from as little as USD 100 and trade micro lots (0.01), so you can start small trading forex while learning.
4. What leverage should a beginner use?
Beginners should use 1:5 to 1:10 maximum. Never use high leverage until you have months of experience and a proven strategy while trading forex.
5. How long should I practise on a demo account?
Stay on demo until you can open, set a stop-loss, and close a trade without hesitation. Most experts recommend 30-60 days of consistent practice before going live or trading forex.
6. What is the best currency pair for beginners?
EUR/USD is the best choice for beginners. It offers the highest liquidity, tightest spreads, and the most educational resources and market analysis.
7. What is the 1% rule in forex?
Never risk more than 1% of your account on any single trade. With a $1,000 account, your maximum loss per trade is $10. This ensures you can survive a series of losing trades.
Conclusion: Your Journey Starts Here
Learning how to start trading forex is not about finding a magic strategy or getting rich overnight. It’s about building a solid foundation of knowledge, developing good habits, and managing risk consistently.
Key takeaways to remember:
Learn the basics — Understand currency pairs, pips, leverage, and margin before you start trading forex.
Keep a journal — Learn from every trade, win or lose.
🎯 Final Thought: The first trade is just the beginning of your journey — focus on learning and disciplined trading. The habits you build while the stakes are small are the ones you will rely on when you eventually scale up.
Further Reading
To deepen your understanding of forex trading, we recommend exploring these additional resources from Finwirestack:
DailyFX Education — Trading education from a leading forex news source.
Disclaimer: Trading forex and CFDs involves significant risk of loss. It is not suitable for all investors. You should carefully consider your investment objectives in trading forex, your level of experience, and your risk appetite before trading forex. Never trade with money you cannot afford to lose. The information provided in this article is for educational purposes only and does not constitute financial advice.
Essential forex trading terminology can feel like a foreign language when you first start looking at currency charts. Terms like “pips,” “margin calls,” and “cable” are thrown around by experienced traders as if they are common knowledge. If you do not understand this essential forex trading terminology, you are essentially trading blind.
But here’s the problem with most glossaries: they just give you definitions without showing you how these terms actually work in real trading scenarios. How do you calculate pip value? How does leverage actually affect your account? What does a margin call look like in numbers? This essential forex trading terminology guide changes that.
This comprehensive guide covers every key term with the following:
🎯 Real-world analogies you can relate to
🧮 Step-by-step calculations with clear math formulas
📊 Professional tables for quick reference
📈 Visual explanations that make complex concepts simple
🎨 Color-coded sections for easy navigation
Whether you’re a complete beginner or an intermediate trader, this guide will give you the essential forex trading terminology knowledge you need—plus the math skills to apply it.
Before diving into the definitions, it is crucial to understand why learning this essential forex trading terminology is non-negotiable.
🔵 Reason 1: You’ll understand market commentary. When analysts say “EUR/USD broke resistance at 1.1200,” you’ll know exactly what that means.
🔵 Reason 2: You’ll avoid costly mistakes. If you don’t understand margin and leverage, you could blow up your account in a single trade. This essential forex trading terminology could save your account.
🔵 Reason 3: You’ll make better decisions. When you understand the math behind each trade, you trade with confidence, not emotion. Understandingessential forex trading terminology gives you that confidence.
According to Investopedia, the forex market is the largest financial market in the world, with over $7.5 trillion traded daily. Understanding the essential forex trading terminology is critical for anyone looking to participate.
BabyPips, one of the most respected forex education platforms, emphasizes that new traders often fail not because of bad strategies but because they don’t understand basic essential forex trading terminology like “margin” and “leverage.”
Part 1: Core Essential Forex Trading Terminology (The Basics)
These are the absolute foundational terms. If you only learn ten words from this entire guide, these should be them. This essential forex trading terminology forms the backbone of every trade you will ever place.
1. Forex (FX) — The Global Currency Marketplace
Definition: Forex, short for foreign exchange, is the global, decentralized marketplace where currencies are traded. It operates 24 hours a day, five days a week, and is the largest financial market in the world. This is arguably the most important piece of essential forex trading terminology to know.
🎯 Real-World Analogy: Think of forex like a giant, 24-hour airport currency exchange booth—but instead of one booth, there are thousands of banks, brokers, and traders all exchanging money with each other at the same time. Understanding this essential forex trading terminology helps you grasp the scale of the market.
Key Facts:
Daily trading volume: $7.5+ trillion
Trading hours: 24 hours, 5 days a week
Market type: Decentralized (Over-the-Counter)
Why It Matters: Unlike the stock market, forex has no central exchange. This means you can trade at any time, but you also need to choose your broker carefully. This essential forex trading terminology affects your trading experience.
2. Currency Pair — The “Price Tag” of Money
Definition: Forex trading always involves trading one currency against another. This is called a currency pair. Understanding currency pairs is a fundamental essential of forex trading terminology.
🎯 Real-World Analogy: Think of a currency pair like a price tag in a store. When you buy a banana, you pay with dollars. In forex, when you buy Euros, you pay with US Dollars. This analogy makes this essential forex trading terminology easy to remember.
Example: EUR/USD = 1.1050
EUR (Euro) is the base currency (the product you’re buying)
USD (US Dollar) is the quote currency (the money you’re paying)
Meaning: 1 Euro costs $1.1050
3. Base Currency vs. Quote Currency
Definition:
🟦 Base Currency: The first currency in the pair. This is the “unit” you are buying or selling. This essential forex trading terminology is used in every trade.
🟩 Quote Currency: The second currency in the pair. This is the “price” of one unit of the base currency. Understanding this essential forex trading terminology helps you read prices.
Example: In GBP/USD = 1.3000:
Base = GBP (British Pound)
Quote = USD (US Dollar)
Meaning: 1 British Pound costs $1.3000
🎯 Real-World Analogy: Imagine going to a store. The “base currency” is the item you want (like a pizza). The “quote currency” is the money you pay (like dollars). If a pizza costs $15, the “pizza/USD” price is 15. This makes essential forex trading terminology relatable.
📊 Table: Currency Pair Examples
Currency Pair
Base Currency
Quote Currency
Price Meaning
EUR/USD = 1.1050
🟦 EUR (Euro)
🟩 USD (US Dollar)
1 Euro = $1.1050
USD/JPY = 145.50
🟦 USD (US Dollar)
🟩 JPY (Japanese Yen)
1 Dollar = 145.50 Yen
GBP/USD = 1.3000
🟦 GBP (British Pound)
🟩 USD (US Dollar)
1 Pound = $1.3000
AUD/USD = 0.6500
🟦 AUD (Australian Dollar)
🟩 USD (US Dollar)
1 Aussie = $0.6500
4. Major Pairs — The Most Liquid Currencies
Definition: The six most heavily traded currency pairs that all include the US Dollar. They offer the highest liquidity and tightest spreads. This essential forex trading terminology is used daily by institutional traders.
The Six Majors:
Pair
Nickname
Liquidity
Typical Spread
EUR/USD
Fiber
Highest
0.1 – 0.5 pips
USD/JPY
Ninja/Gopher
Very High
0.2 – 0.7 pips
GBP/USD
Cable
Very High
0.3 – 1.0 pips
USD/CHF
Swissy
High
0.5 – 1.5 pips
AUD/USD
Aussie
High
0.5 – 1.5 pips
USD/CAD
Loonie
High
0.5 – 1.5 pips
🟦 Blue Highlight: Tighter spreads mean lower costs. Higher liquidity means less slippage. This essential forex trading terminology is essential for choosing what to trade.
5-6. Cross Pairs & Exotic Pairs
Pair Type
Definition
Examples
Characteristics
Cross Pairs
No USD involved
EUR/GBP, GBP/JPY, EUR/JPY
Wider spreads than majors
Exotic Pairs
Major + Emerging currency
USD/TRY, USD/ZAR, USD/SGD
Very wide spreads, high volatility
⚠️ Orange Warning: Exotic pairs can have spreads of 10-50+ pips. This means you start your trade significantly in the red. This essential forex trading terminology helps you avoid costly mistakes.
7. Pip (Percentage in Point)—The “Inch” of Forex
Definition: The standard unit of measurement for price movement. This is the most important piece of essential forex trading terminology for calculating profit and loss.
For most pairs (EUR/USD, GBP/USD, AUD/USD):
1 pip = 0.0001 (fourth decimal place)
Example: EUR/USD moves from 1.1050 to 1.1051 = 1 pip
For JPY pairs (USD/JPY, EUR/JPY):
1 pip = 0.01 (second decimal place)
Example: USD/JPY moves from 145.50 to 145.51 = 1 pip
🎯 Real-World Analogy: Think of a pip like an inch on a ruler. Just as an inch measures distance, a pip measures price movement. If a ruler moves from 10 inches to 11 inches, it has moved 1 inch. If EUR/USD moves from 1.1050 to 1.1051, it moved 1 pip. This analogy makes essential forex trading terminology easy to grasp.
📊 Table: Pip Values by Lot Size (EUR/USD)
Lot Size
Units
Pip Value (USD)
🟦 Standard Lot (1.0)
100,000
$10.00
🟩 Mini Lot (0.1)
10,000
$1.00
🟨 Micro Lot (0.01)
1,000
$0.10
🟧 Nano Lot (0.001)
100
$0.01
🧮 Pip Calculation Example (Step-by-Step)
Scenario: You buy 1 standard lot (100,000 units) of EUR/USD at 1.1050 and sell at 1.1070.
✅ Result: You made a 4% return on your account in one trade. Understanding this essential forex trading terminology helps you calculate your returns.
🎯 Real-World Analogy: Imagine buying a product for $1.1050 and selling it for $1.1070. You made $0.0020 profit per unit. With 100,000 units, your profit is $200. This essential forex trading terminology calculation is used every day by traders.
8. Pipette — The “Fractional Inch”
Definition: A fractional pip, representing one-tenth of a pip. This essential forex trading terminology reflects modern trading precision.
Example: EUR/USD at 1.10501
The 4th decimal (0) = pip
The 5th decimal (1) = pipette
Why It Matters: Modern platforms display pipettes for greater precision. When you see 1.10501, the “1” is the pipette. This essential forex trading terminology helps you understand price quotes.
9-11. Bid, Ask, and Spread — The Cost of Trading
🎯 Real-World Analogy: Imagine a currency exchange booth at the airport. They have two prices:
The price they will buy your currency at (lower)
The price they will sell you currency at (higher)
The difference is how they make money. This essential forex trading terminology explains how brokers profit.
Bid Price: The price at which the broker will buy the base currency from you. This essential forex trading terminology is displayed on every trading platform. Ask Price: The price at which the broker will sell the base currency to you. Together with the bid, this forms core essential forex trading terminology. Spread: The difference between Ask and Bid (the broker’s fee). Understanding spreads is a vital essential forex trading term.
Example: EUR/USD
Ask: 1.1050
Bid: 1.1048
Spread = 1.1050 – 1.1048 = 0.0002 = 2 pips
🟦 Blue Highlight: A tighter spread means lower trading costs. For beginners, trading majors with tight spreads is highly recommended. This essential forex trading terminology directly affects your profitability.
🧮 Spread Cost Calculation
Scenario: You buy 1 standard lot of EUR/USD with a 2-pip spread.
Step 1: Identify the spread
Spread = 2 pips
Step 2: Calculate the cost
Pip value for 1 standard lot = $10
Cost = 2 pips × $10 = **$20**
✅ Result: You start your trade $20 in the red. The price must move 2 pips in your favor just to break even. This essential forex trading terminology calculation shows why spreads matter.
🔴 Red Highlight: This is why spreads matter. If you trade exotic pairs with 20-pip spreads, you need to make 20 pips just to break even. This essential forex trading terminology could save you money.
12-13. Liquidity & Volatility
Term
Definition
Impact on Trading
🟦 Liquidity
Ability to buy/sell without causing price changes
High liquidity = tight spreads, fast execution
🟧 Volatility
Speed and magnitude of price changes
High volatility = big moves (risk and opportunity)
📊 Table: Pair Types Comparison
Pair Type
Liquidity
Spreads
Volatility
Slippage Risk
🟦 Major Pairs
Highest
Tightest
Moderate
Lowest
🟩 Minor Pairs
High
Moderate
Moderate
Moderate
🟧 Exotic Pairs
Low
Wide
Very High
Highest
14. Bullish vs. Bearish — Market Sentiment
🟦 Bullish: Expecting prices to rise (bulls thrust horns up)
🔴 Bearish: Expecting prices to fall (bears swipe claws down)
Example: If you are bullish on EUR/USD, you expect the Euro to strengthen against the Dollar. You would buy (go long). This essential forex trading terminology describes market sentiment.
If you are bearish on EUR/USD, you expect the Euro to weaken. You would sell (go short). Understanding this essential forex trading terminology helps you read the market.
🎯 Real-World Analogy: Imagine a sports game. “Bullish” traders are like fans cheering for their team to win. “Bearish” traders are like fans expecting their team to lose. This essential forex trading terminology is used daily by analysts.
Part 2: Order Types — How to Enter and Exit Trades
Understanding order types is a critical part of essential forex trading terminology. Using the wrong order at the wrong time can cost you a breakout opportunity or cause devastating slippage.
15. Market Order — Instant Execution
Definition: An order to buy or sell immediately at the current best available price. This is the most commonly used essential forex trading terminology.
🎯 Real-World Analogy: Walking into a store and buying a product at the displayed price. You don’t haggle—you pay and leave. This makes essential forex trading terminology easy to remember.
When to Use: When speed is more important than price precision.
Example: You see EUR/USD at 1.1050 and want to enter immediately. You place a Market Order to buy. The broker fills you at the current Ask price (1.1050).
⚠️ Orange Warning: In volatile markets, the price may move between clicking and execution (slippage). This essential forex trading terminology warns you of potential issues.
16. Limit Order — Price Precision
Definition: An order to buy or sell only at a specific price or better. This essential forex trading terminology helps you get better entries.
🎯 Real-World Analogy: You decide to buy a used car, but only if the price drops to $10,000. You tell the dealer: “Call me if the price hits $10,000.” That’s a limit order. This essential forex trading terminology analogy is easy to understand.
When to Use: When price precision is more important than speed.
Example: EUR/USD is at 1.1050. You want to buy, but only if the price drops to 1.1000.
You place a Buy Limit Order at 1.1000. The trade will only execute if the price drops to 1.1000.
🟦 Blue Highlight: Limit orders guarantee your price but not your execution. The market might never reach your limit price. This essential forex trading terminology helps you manage expectations.
17. Stop Order (Stop Entry) — Breakout Trading
Definition: An order that becomes a market order once a specific price is hit. Used to trade breakouts. This essential forex trading terminology is crucial for breakout traders.
🎯 Real-World Analogy: You’re waiting for a stock to break above $50. You tell your broker, “If the price hits $50.05, buy immediately.” That’s a stop order. This essential forex trading terminology is used by breakout traders.
When to Use: When you want to enter a trade only if the price breaks a key level.
Example: EUR/USD is at 1.1050. Resistance is at 1.1100. You believe a breakout above 1.1100 will lead to a rally.
You place a Buy Stop Order at 1.1105. If the price breaks above 1.1100 and hits 1.1105, your order triggers and you buy.
18. Stop Loss (SL) 🔴 — Your Safety Net
Definition: A pre-set order to close a trade at a specific price to cap your loss. This is the most important risk management tool. This is the most important essential forex trading terminology for survival.
🎯 Real-World Analogy: Like an airbag in a car. You hope you never need it, but you’re glad it’s there if things go wrong. This essential forex trading terminology analogy helps you remember its importance.
When to Use: Every single trade. Never enter without a stop loss. This essential forex trading terminology could save your account.
🟦 Blue Highlight: This is the most important piece of essential forex trading terminology for survival.
🧮 Stop Loss Calculation (Step-by-Step)
Scenario: You buy EUR/USD at 1.1050. You want to risk 1% of a $5,000 account. You are trading a Mini Lot (0.1).
Step 1: Calculate risk in dollars
1% of $5,000 = **$50 risk**
Step 2: Identify pip value
Mini Lot (0.1) pip value = $1 per pip
Step 3: Calculate pip distance for stop loss
Pip distance = $50 risk ÷ $1 per pip = 50 pips
Step 4: Set stop-loss level
Entry: 1.1050
Stop loss: 1.1050 – 0.0050 = 1.1000
✅ Result: Your stop loss is at 1.1000. If the price drops 50 pips, your loss is capped at $50. This essential forex trading terminology calculation is used by every professional trader.
📊 Table: Stop Loss Distance by Risk Amount
Account Size
Risk %
Risk $
Lot Size
Pip Value
Stop Loss (Pips)
$1,000
1%
$10
🟨 Micro (0.01)
$0.10
100 pips
$5,000
1%
$50
🟩 Mini (0.1)
$1.00
50 pips
$10,000
1%
$100
🟩 Mini (0.1)
$1.00
100 pips
$50,000
1%
$500
🟦 Standard (1.0)
$10.00
50 pips
19. Take Profit (TP) 🟢 — Locking in Gains
Definition: A pre-set order to close a trade at a specific price to lock in your gains. This essential forex trading terminology helps you secure profits.
🎯 Real-World Analogy: Like setting an alarm clock. When the price reaches your target, the “alarm” goes off and you automatically take your profit. This essential forex trading terminology analogy is easy to remember.
When to Use: Every single trade. Don’t get greedy—take profits when your target is hit. This essential forex trading terminology helps you stay disciplined.
Example: You buy EUR/USD at 1.1050. Your target is 1.1150.
You set a Take Profit at 1.1150. When the price reaches 1.1150, your trade automatically closes, locking in a 100-pip profit.
🧮 Risk/Reward Ratio Calculation
Scenario: Your stop loss is at 1.1000 (50 pips risk). Your take profit is at 1.1150 (100 pips reward).
Step 1: Calculate risk in pips
Risk = 50 pips
Step 2: Calculate reward in pips
Reward = 100 pips
Step 3: Calculate risk/reward ratio
R:R = Risk ÷ Reward = 50 ÷ 100 = 1:2
✅ Result: Your risk/reward ratio is 1:2. You risk $50 to make $100. This essential forex trading terminology calculation determines your profitability.
📊 Table: Break-Even Win Rates by R:R
R:R Ratio
Risk $
Reward $
Win Rate Needed
Break-Even Win Rate
1:1
$100
$100
50%
50%
🟦 1:2
$100
$200
33%
✅ 33%
1:3
$100
$300
25%
25%
1:4
$100
$400
20%
20%
🟦 Blue Highlight: With a 1:2 risk/reward ratio, you only need to win 33% of your trades to break even. This is why professional traders prioritize risk/reward over win rate. This essential forex trading terminology concept is crucial for profitability.
20. Trailing Stop — Letting Winners Run
Definition: A dynamic stop loss that moves in your favor as the price moves in your favor. This advanced essential forex trading terminology is used by professional traders.
🎯 Real-World Analogy: Imagine following a moving target. As the target moves forward, you move your aim forward too. If the target stops, you stop. This essential forex trading terminology analogy helps you understand the concept.
Example: You buy EUR/USD at 1.1050 with a 50-pip trailing stop.
Price moves to 1.1100 (+50 pips) → Stop loss moves from 1.1000 to 1.1050
Price moves to 1.1150 (+100 pips) → Stop loss moves to 1.1100
Price reverses to 1.1100 → Stop loss triggers, locking in 50 pips profit
🟦 Blue Highlight: Trailing stops lock in profits while letting winning trades run. This essential forex trading terminology helps you maximize winning trades.
This is the most crucial part of essential forex trading terminology for survival. If you ignore these terms, you will blow up your account.
26-27. Long vs. Short Position
🟦 Long: Buying the base currency (betting it will rise). This is basic essential forex trading terminology.
🔴 Short: Selling the base currency (betting it will fall). This essential forex trading terminology is essential for trading both directions.
Example:
Long EUR/USD: You buy Euros, sell Dollars. Profit if EUR/USD rises.
Short EUR/USD: You sell Euros, buy Dollars. Profit if EUR/USD falls.
28. Leverage ⚠️ — The Double-Edged Sword
Definition: Borrowed capital provided by the broker to increase your position size. This is dangerous essential forex trading terminology that must be respected.
🎯 Real-World Analogy: Leverage is like a magnifying glass. It makes everything bigger—both the good and the bad. A tiny flame becomes a roaring fire. A small loss becomes a disaster. This essential forex trading terminology analogy helps you understand the risk.
Formula:
Position Size = Account Balance × Leverage
Example:
Account: $1,000
Leverage: 100:1
Buying power: $1,000 × 100 = $100,000
📊 Table: Leverage Effects
Account Size
Leverage
Buying Power
1% Move Profit/Loss
$1,000
1:1
$1,000
$10
$1,000
10:1
$10,000
$100
$1,000
50:1
$50,000
$500
$1,000
100:1
$100,000
$1,000
🔴 Red Highlight: High leverage amplifies both profits and losses. A 1% move with 100:1 leverage means the following:
Profit: +100% of your account
Loss: -100% of your account (you lose everything)
🟦 Blue Highlight: Beginners should use 1:5 to 1:10 leverage maximum. Never use maximum leverage. This essential forex trading terminology could save your account.
🧮 Leverage Calculation (Real Example)
Scenario: You have a $5,000 account. You use 50:1 leverage.
Step 1: Calculate buying power
Buying power = $5,000 × 50 = **$250,000**
Step 2: Calculate position size in lots
1 standard lot = 100,000 units
$250,000 ÷ $100,000 = 2.5 standard lots
Step 3: Calculate profit/loss on a 100-pip move
1 standard lot pip value = $10
2.5 lots pip value = $25 per pip
100 pips × $25 = **$2,500**
✅ Result: A 100-pip move makes or loses $2,500—which is 50% of your account. This essential forex trading terminology calculation shows why leverage is dangerous.
🔴 Red Highlight: This is why proper position sizing is essential. A 100-pip move can wipe out half your account. This essential forex trading terminology concept is crucial for survival.
29. Margin — The “Good Faith Deposit”
Definition: The collateral required to open a leveraged position. It’s a “good faith deposit.” This essential forex trading terminology is often misunderstood by beginners.
🎯 Real-World Analogy: Margin is like a security deposit on an apartment. You don’t own the apartment, but you pay a deposit to show you’re serious. This essential forex trading terminology analogy helps you understand the concept.
Formula:
Margin Required = Position Size ÷ Leverage
Example:
Position size: $100,000
Leverage: 100:1
Margin required: $100,000 ÷ 100 = $1,000
🧮 Margin Calculation (Real Example)
Scenario: You want to trade 2 standard lots (200,000 units) of EUR/USD. Your broker offers 50:1 leverage.
Step 1: Calculate total position size
2 lots × 100,000 = $200,000
Step 2: Calculate margin required
Margin = $200,000 ÷ 50 = **$4,000**
✅ Result: You need $4,000 in your account to open this trade. This essential forex trading terminology calculation helps you plan your trades.
📊 Table: Margin Requirements by Leverage
Leverage
Margin Required for 1 Standard Lot
Margin Required for 1 Mini Lot
1:1
$100,000
$10,000
10:1
$10,000
$1,000
30:1
$3,333
$333
50:1
$2,000
$200
100:1
$1,000
$100
500:1
$200
$20
30-35. Margin and Equity Terms
📊 Table: Account Terminology
Term
Definition
Formula
Balance
Cash after all trades closed
N/A
Equity
Real-time account value
Balance + Floating P&L
Used Margin
Collateral locked up
Position Size ÷ Leverage
Free Margin
Available to open new trades
Equity – Used Margin
Floating P&L
Unrealized profit/loss
(Current Price – Entry Price) × Position Size
Realized P&L
Locked in profit/loss
Closing Price – Opening Price
🧮 Equity Calculation (Real Example)
Scenario: Your account has:
Balance: $10,000
Open trade: 1 standard lot EUR/USD
Entry: 1.1050
Current price: 1.1080 (+30 pips)
Pip value: $10 per pip
Step 1: Calculate the floating P&L
Profit = 30 pips × $10 = **+$300** 🟩
Step 2: Calculate equity
Equity = Balance + Floating P&L
Equity = $10,000 + $300 = $10,300 🟦
Step 3: Calculate free margin
Used Margin = $1,000 (for 1 standard lot at 100:1)
Free Margin = Equity – Used Margin
Free Margin = $10,300 – $1,000 = $9,300 🟩
✅ Result: You have $9,300 available to open new trades. This essential forex trading terminology calculation helps you manage your account.
36. Margin Call 🔴 — The Warning Signal
Definition: A warning from the broker that your Equity has dropped too low relative to your Used Margin. These are critical essential forex trading terms to avoid.
🎯 Real-World Analogy: Like a low fuel warning in your car. You haven’t run out of fuel yet, but you will soon if you don’t act. This essential forex trading terminology analogy helps you remember to act.
When It Happens:
Your losing trades are eating into your equity
Your equity approaches your used margin level
Real Example:
Used Margin: $1,000
Equity: $1,100 (falling)
Margin Call Level: 100% (equity = used margin)
If equity falls below $1,000 → 🔴 MARGIN CALL
What to Do:
Close losing trades immediately
Add more funds to your account
Reduce position sizes for future trades
37. Stop Out ⚠️ — Forced Liquidation
Definition: Forced liquidation of your open positions by the broker. This essential forex trading terminology is your final warning.
🎯 Real-World Analogy: Like the tow truck that takes your car when you run out of fuel on the highway. You don’t want it to happen, but it will if you ignore the warnings. This essential forex trading terminology analogy helps you understand the consequences.
When It Happens: When you ignore the margin call and equity continues to fall.
Real Example:
Used Margin: $1,000
Equity: $800 (below 100%)
Stop Out Level: 50% (equity = 50% of margin)
If equity falls below $500 → 🔴 STOP OUT
What Happens: The broker automatically closes your positions, starting with the most losing trade.
🟦 Blue Highlight: This is why you always use stop losses. Stop-outs happen at the worst possible price. This essential forex trading terminology could save your account.
🧮 Margin Call & Stop Out Calculation
Scenario: You have a $2,000 account. You open 1 standard lot of EUR/USD at 100:1 leverage.
Step 1: Calculate the used margin
1 lot = $100,000
$100,000 ÷ 100 = **$1,000 used margin**
Step 2: Calculate pip value
1 standard lot = $10 per pip
Step 3: Find the margin call level
Margin Call Level: 100% (equity = used margin)
Equity must stay above $1,000
Step 4: Calculate the losing move
Current equity: $2,000
Margin call at: $1,000
Loss needed: $2,000 – $1,000 = $1,000
Pips to margin call: $1,000 ÷ $10 = 100 pips
✅ Result: If EUR/USD moves 100 pips against you, you get a margin call. This essential forex trading terminology calculation helps you plan your risk.
📊 Table: Margin Call Levels
Account Size
Used Margin
Pip Value
Pips Until Margin Call
$2,000
$1,000
$10
100 pips
$5,000
$1,000
$10
400 pips
$10,000
$1,000
$10
900 pips
38. Drawdown — The Cost of Losing
Definition: The peak-to-trough decline in your account balance during a specific period. Understanding drawdown is essential for forex trading terminology.
🎯 Real-World Analogy: Like falling into a hole. The deeper the hole, the harder it is to climb out. This essential forex trading terminology analogy helps you understand the risk.
🔴 Red Highlight: A 50% drawdown requires a 100% gain to recover. This is why risk management is essential. This essential forex trading terminology concept is crucial for long-term survival.
39-40. Lot Size & Pip Value
Definition:
Lot Size: The standardized volume of a trade. This essential forex trading terminology determines your position size.
Pip Value: The actual monetary value of one pip movement. This essential forex trading terminology helps you calculate risk.
📊 Table: Lot Sizes and Pip Values
Lot Type
Units
Abbreviation
Pip Value (USD)
🟦 Standard Lot
100,000
1.0
$10
🟩 Mini Lot
10,000
0.1
$1
🟨 Micro Lot
1,000
0.01
$0.10
🟧 Nano Lot
100
0.001
$0.01
💡 Pro Tip: Start with micro lots (0.01) to minimize risk while learning. This essential forex trading terminology advice could save your account.
41. Position Sizing — The Golden Rule
Definition: The process of calculating how much of a currency to buy or sell based on your account size and risk tolerance. This is the most important essential forex trading terminology for long-term survival.
🎯 Real-World Analogy: Like measuring ingredients for a recipe. Too much salt ruins the dish. Too much risk ruins your account. This essential forex trading terminology analogy helps you remember its importance.
🟦 Blue Highlight: This is the most important piece of essential forex trading terminology for long-term survival.
The 1% Rule: Never risk more than 1% of your account on a single trade.
Why: If you risk 1% per trade, you can lose 20 trades in a row and still have 80% of your account. If you risk 10% per trade, 10 losing trades wipe you out. This essential forex trading terminology rule is used by professional traders.
🧮 Position Sizing Calculation (The Golden Formula)
Scenario: You have a $5,000 account. You risk 1% per trade. You want to trade EUR/USD. Your stop loss is 30 pips.
Step 1: Calculate risk in dollars
1% of $5,000 = **$50** 🔴
Step 2: Calculate pip value needed
Stop loss = 30 pips
Risk per pip = $50 ÷ 30 pips = **$1.67 per pip** 🟦
Step 3: Calculate lot size
1 standard lot = $10 per pip
1 mini lot = $1 per pip
$1.67 per pip = 0.167 mini lots (or 1.67 micro lots)
✅ Result: Your position size should be 0.167 lots (approx. 0.17 mini lots). This essential forex trading terminology calculation is used by every professional trader.
📊 Table: Position Sizing Examples
Account Size
Risk %
Risk $
Stop Loss (Pips)
Position Size
$1,000
1%
$10
50 pips
0.02 lots (2 micro)
$5,000
1%
$50
30 pips
0.17 lots (1.7 mini)
$10,000
1%
$100
40 pips
0.25 lots (2.5 mini)
$50,000
1%
$500
50 pips
1.00 lots (1 standard)
42. Risk/Reward Ratio (R: R)
Definition: The ratio of potential loss to potential gain. This essential forex trading terminology determines your profitability.
🎯 Real-World Analogy: Like betting on a horse. If you risk $10 to win $30, your risk/reward ratio is 1:3. This essential forex trading terminology analogy helps you understand the concept.
Formula:
R:R = Potential Loss ÷ Potential Gain
Example:
Stop Loss: 20 pips below entry
Take Profit: 60 pips above entry
R:R = 20 ÷ 60 = 1:3
📊 Table: Profitability Matrix (Win Rate vs. R:R)
Win Rate
1:1 R:R
1:2 R:R
1:3 R:R
30%
🔴 -40%
🔴 -10%
🟩 20%
40%
🔴 -20%
🟩 20%
🟩 60%
50%
🟦 0%
🟩 50%
🟩 100%
60%
🟩 20%
🟩 80%
🟩 140%
🟦 Blue Highlight: Even with a 40% win rate, a 1:3 R:R ratio is profitable. This is why professionals focus on R: R, not win rate. This essential forex trading terminology concept is crucial for profitability.
43. Win Rate
Definition: The percentage of trades that result in a profit. This essential forex trading terminology must be balanced with risk/reward.
Formula:
Win Rate = Winning Trades ÷ Total Trades × 100
Example: 50 winning trades out of 100 total = 50% win rate
🔴 Red Highlight: A 70% win rate is useless if your average loss is larger than your average win. Always balance win rate with risk/reward. This essential forex trading terminology concept is often misunderstood by beginners.
Part 4: Forex Slang (Trader Nicknames)
This part of essential forex trading terminology is what separates the novices from the insiders. If you hear someone say “Cable is looking weak,” you need to know they are talking about GBP/USD.
Slang Term
Meaning
Why It’s Called That
Cable
GBP/USD
Transatlantic telegraph cable
Loonie
USD/CAD
Loon bird on Canadian coin
Aussie
AUD/USD
Australian Dollar
Kiwi
NZD/USD
New Zealand’s national bird
Swissy
USD/CHF
Swiss Franc
Dragon
GBP/JPY
Extreme volatility (“fire-breathing”)
Fiber
EUR/USD
Fiber optic cables
Greenback
USD
Color of US currency
Old Lady
Bank of England
Historic nickname
Hawkish
Pro-higher rates
Hawk = aggressive
Dovish
Pro-lower rates
Dove = peaceful
Part 5: Technical Analysis Terminology
If you plan to trade using charts, these essential forex trading terminology entries are essential for reading price action.
📊 Key Technical Terms with Examples
Term
Definition
Example
Support
Price “floor” where buying is strong
EUR/USD bounces at 1.1000 three times
Resistance
Price “ceiling” where selling is strong
The EUR/USD was rejected at 1.1200 twice
Breakout
The price explodes through support/resistance
EUR/USD closes above 1.1200 = BUY signal
Pullback
Temporary reversal against the trend
EUR/USD dips to 1.1150 before continuing up
Moving Average
Smoothed price line
50-day MA shows trend direction
RSI
Momentum oscillator
RSI > 70 = overbought, RSI < 30 = oversold
Divergence
Price and indicator move opposite
Price makes a higher high, RSI makes a lower high = BEARISH
Part 6: Fundamental Analysis Terminology
These terms relate to the economic factors that drive long-term currency values. Understanding this essential forex trading terminology helps you trade the news.
📰 Key Fundamental Terms with Examples
Term
Definition
Market Impact
Interest Rate
Central bank policy rate
A higher rate = stronger currency
CPI
Inflation measure
Rising CPI = higher rates expected
NFP
US employment report
The biggest USD volatility event
GDP
Economic growth measure
Strong GDP = strong currency
QE
Central bank buying bonds
QE = currency weakens
Forward Guidance
Central bank signals
“We may hike in 6 months” = currency strengthens
Safe Haven
Risk-off currency
USD, JPY, CHF strengthen in crises
Conclusion: Why Mastering This Essential Forex Trading Terminology Changes Everything
Learning essential forex trading terminology is the first and most critical step toward becoming a confident trader. This glossary is not a one-time read; it is a living document you should bookmark and revisit.
When you understand this essential forex trading terminology:
You gain confidence: You stop second-guessing every button you click on your trading platform. This essential forex trading terminology gives you the knowledge you need.
You identify scams: If an “expert” promises guaranteed returns but doesn’t know what a “margin call” is, you’ll know to run the other way. This essential forex trading terminology protects you from fraud.
You interpret the news: You can finally understand what analysts mean when they say “The Fed is turning hawkish” or “We are seeing a liquidity sweep.” This essential forex trading terminology helps you understand market commentary.
You survive: Proper risk management, essential forex trading terminology, is the difference between a long trading career and blowing up your account in a week.
You trade like a pro: Professionals speak this language fluently. When you understand essential forex trading terminology, you can participate in conversations, analyze markets, and make decisions with clarity.
Keep this guide open as you learn, reference it when you are confused, and soon these words will become second nature. This essential forex trading terminology will serve you throughout your trading career.
Frequently Asked Questions (FAQ)
1. How do I calculate the pip value for any currency pair?
For USD quote pairs: Pip Value = (0.0001 ÷ Exchange Rate) × Lot Size. For simplicity, remember: a standard lot = $10/pip, Mini lot = $1/pip, Micro lot = $0.10/pip. This essential forex trading terminology calculation is used every day by traders.
2. What leverage should a beginner use?
Beginners should use 1:5 to 1:10 maximum. Never use 100:1 or higher until you have months of experience and a proven strategy. This essential forex trading terminology advice could save your account.
3. What is the 1% rule in forex?
Never risk more than 1% of your account on any single trade. With a $10,000 account, your maximum loss per trade is $100. This essential forex trading terminology rule is followed by professional traders.
4. What’s the difference between a Stop Loss and a Take Profit?
Stop Loss: Caps your loss (safety net) 🔴
Take Profit: Locks in your gain (target) 🟢 Both are essential for every trade. This essential forex trading terminology helps you manage every trade.
5. Do I need to know all the slang to trade profitably?
No. Slang helps you understand market conversations, but it’s not necessary. The technical terms—Pip, Spread, Leverage, Margin, Stop Loss, and Position Sizing—are what you absolutely must know. This essential forex trading terminology is non-negotiable.
6. What is the most important forex trading terminology for beginners?
The most important essential forex trading terminology for beginners includes: Pip, Spread, Leverage, Margin, Stop Loss, Take Profit, and Position Sizing. Mastering these seven terms will protect your capital and give you a solid foundation.
7. How can I remember all this terminology?
We recommend keeping this glossary open while you practice on a demo account. Every time you encounter a term you don’t understand, refer back to this guide. Over time, this essential forex trading terminology will become second nature.
Further Reading
To deepen your understanding of the forex market, we recommend exploring these additional resources from Finwirestack:
BabyPips Forex School — The most popular free forex education platform for beginners.
FXStreet Education — Daily market analysis and educational articles for forex traders.
DailyFX Education — Trading education and market insights from a leading forex news source.
Disclaimer: Trading forex and CFDs involves significant risk of loss. It is not suitable for all investors. You should carefully consider your investment objectives, level of experience, and risk appetite before trading. Never trade with money you cannot afford to lose. The information provided in this article is for educational purposes only and does not constitute financial advice.