Physical Address
Remote team based in Bozeman, Montana.
Physical Address
Remote team based in Bozeman, Montana.
Technical vs fundamental analysis: Which trading strategy wins? Learn both approaches with real examples, compare their pros and cons, and discover the hybrid method used by professionals.
Technical vs fundamental analysis is one of the oldest debates in trading. Walk into any trading room, and you will find passionate advocates on both sides. Technical traders stare at charts, believing all market information is reflected in price. Fundamental traders study economic data, convinced that currency values are driven by interest rates, inflation, and growth.
But here’s the truth: technical vs fundamental analysis isn’t about choosing a winner. It’s about understanding which approach fits your personality, time horizon, and trading goals.
This guide breaks down both technical vs fundamental analysis methods with real examples, clear comparisons, and practical advice. You will learn:
By the end, you will understand technical vs fundamental analysis well enough to decide which path—or combination—is right for you.
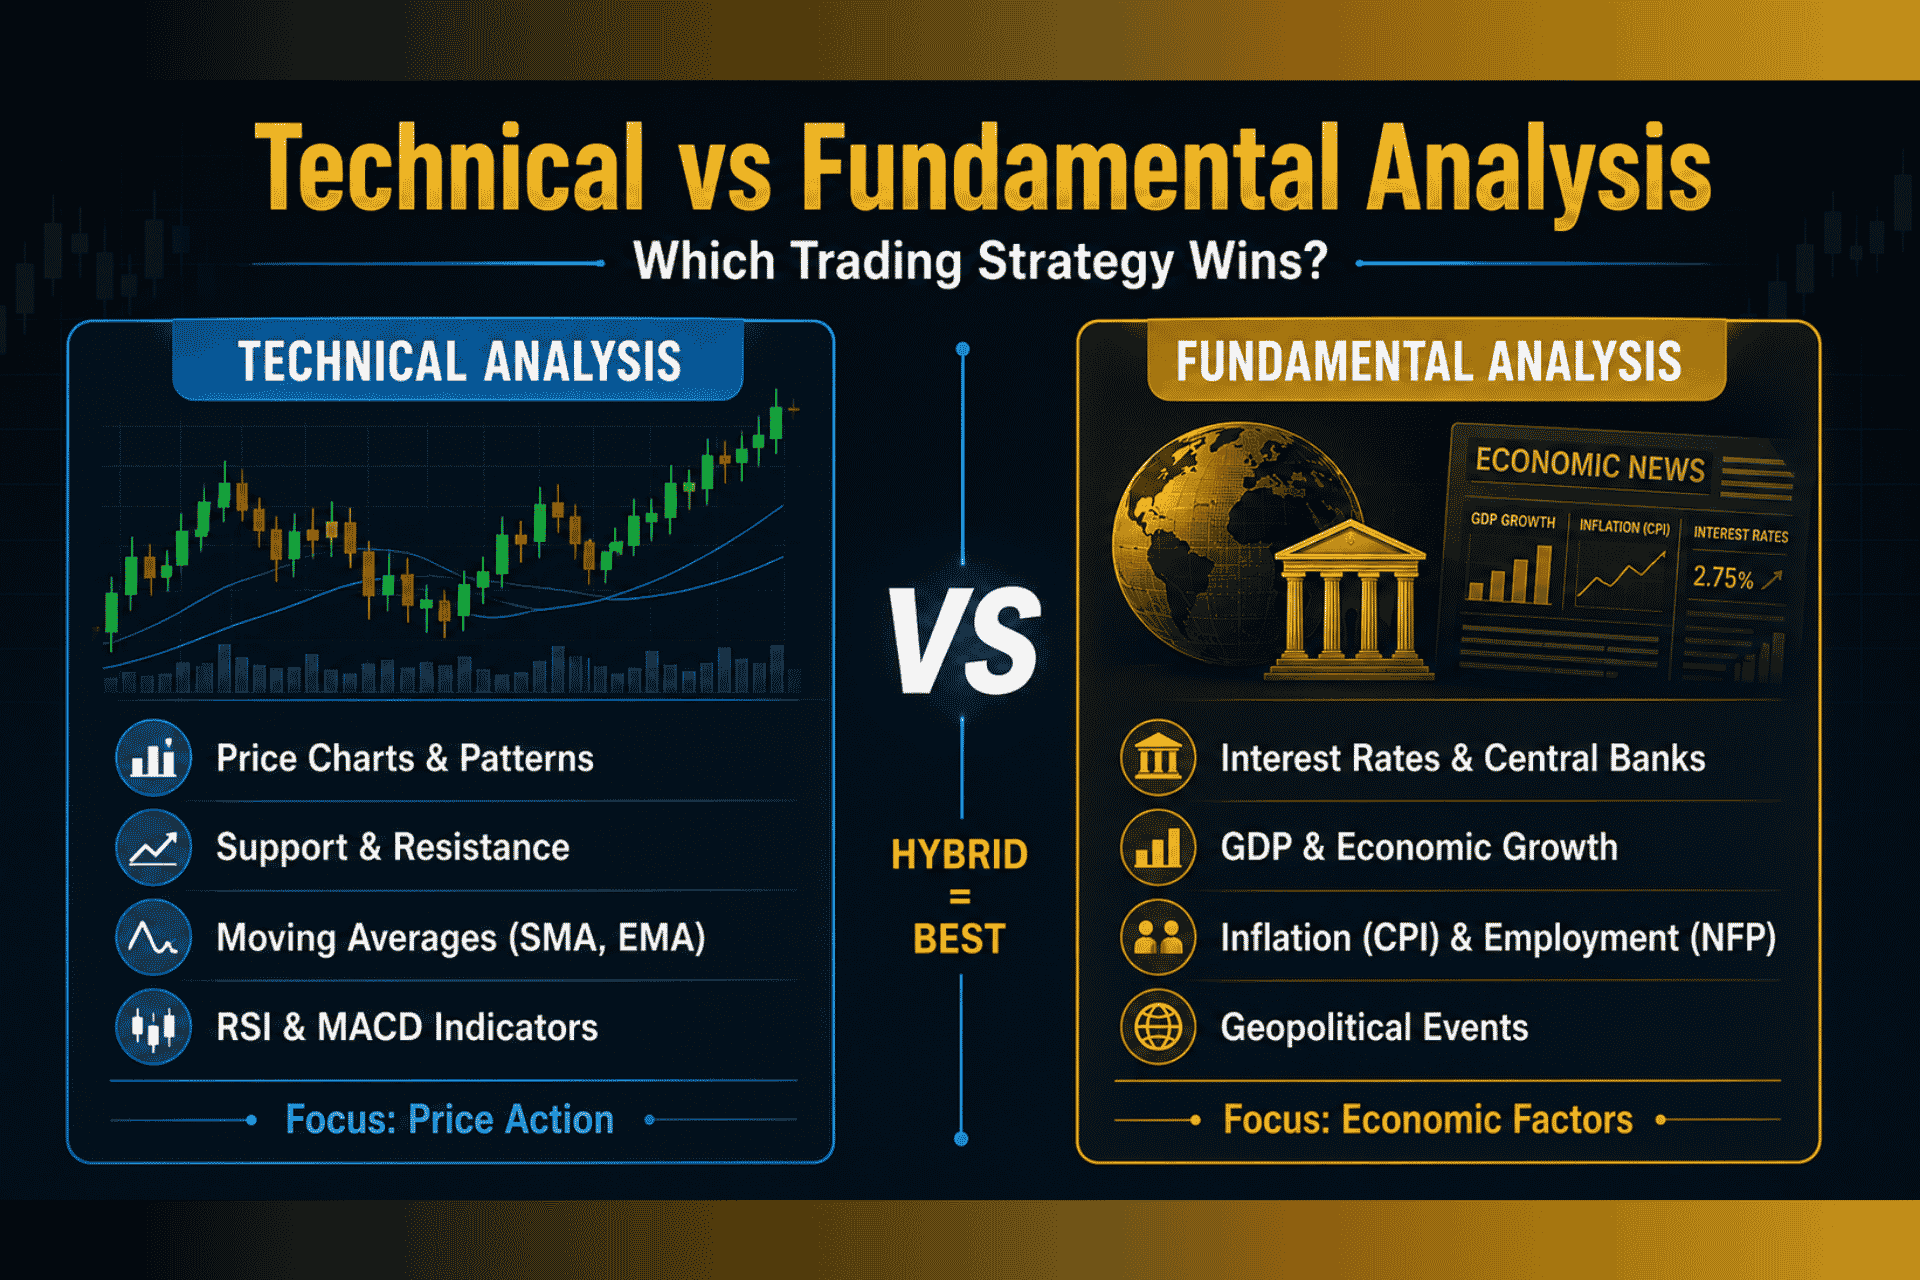
Technical analysis is the study of price action and market behavior using charts and indicators. It operates on three core assumptions:
Technical traders don’t care why the price moved. They care about what the price is doing right now and what it might do next based on historical patterns.
1. Price Charts (Candlestick, Line, Bar)
The foundation of technical vs fundamental analysis when using charts. Candlestick charts show open, high, low, and close prices for each time period.
🎯 Real-World Analogy: A candlestick chart is like a weather map. It shows what happened (rain or sun) but doesn’t tell you why. You just use it to predict tomorrow’s weather.
2. Support and Resistance
3. Moving Averages (SMA, EMA)
4. RSI (Relative Strength Index)
A momentum oscillator measuring the speed of price changes:
5. MACD (Moving Average Convergence Divergence)
Shows the relationship between two moving averages to identify momentum shifts.
6. Candlestick Patterns
Specific formations suggesting reversals or continuations:
| Tool | Purpose | Signal |
|---|---|---|
| Support/Resistance | Identify price levels | Breakout or bounce |
| Moving Averages | Determine trend direction | Crossovers signal entries |
| RSI | Measure momentum | Overbought/oversold conditions |
| MACD | Identify momentum shifts | Crossover of signal line |
| Candlestick Patterns | Predict reversals | Specific pattern formations |
Fundamental analysis examines the economic, financial, and political factors that drive currency values. It assumes that currencies have intrinsic values based on the health of their underlying economies.
Fundamental traders ask: “What is happening in this country’s economy, and how will that affect its currency?”
1. Interest Rates and Central Bank Policy
The most important driver of currency values. Higher interest rates attract foreign investment, strengthening the currency.
🎯 Real-World Analogy: Think of interest rates like the “price of money.” When the price is high, everyone wants to “buy” that currency to get a better return. When the price is low, demand drops.
2. Inflation (CPI)
3. Employment Data (NFP)
US Non-farm Payrolls is the biggest monthly event for USD pairs. Strong employment = stronger currency.
4. GDP (Gross Domestic Product)
Measures economic growth. Strong GDP = strong currency.
5. PMI (Purchasing Managers’ Index)
Survey-based indicator of economic health:
6. Geopolitical Events
Wars, elections, trade disputes, and political instability impact currency values.
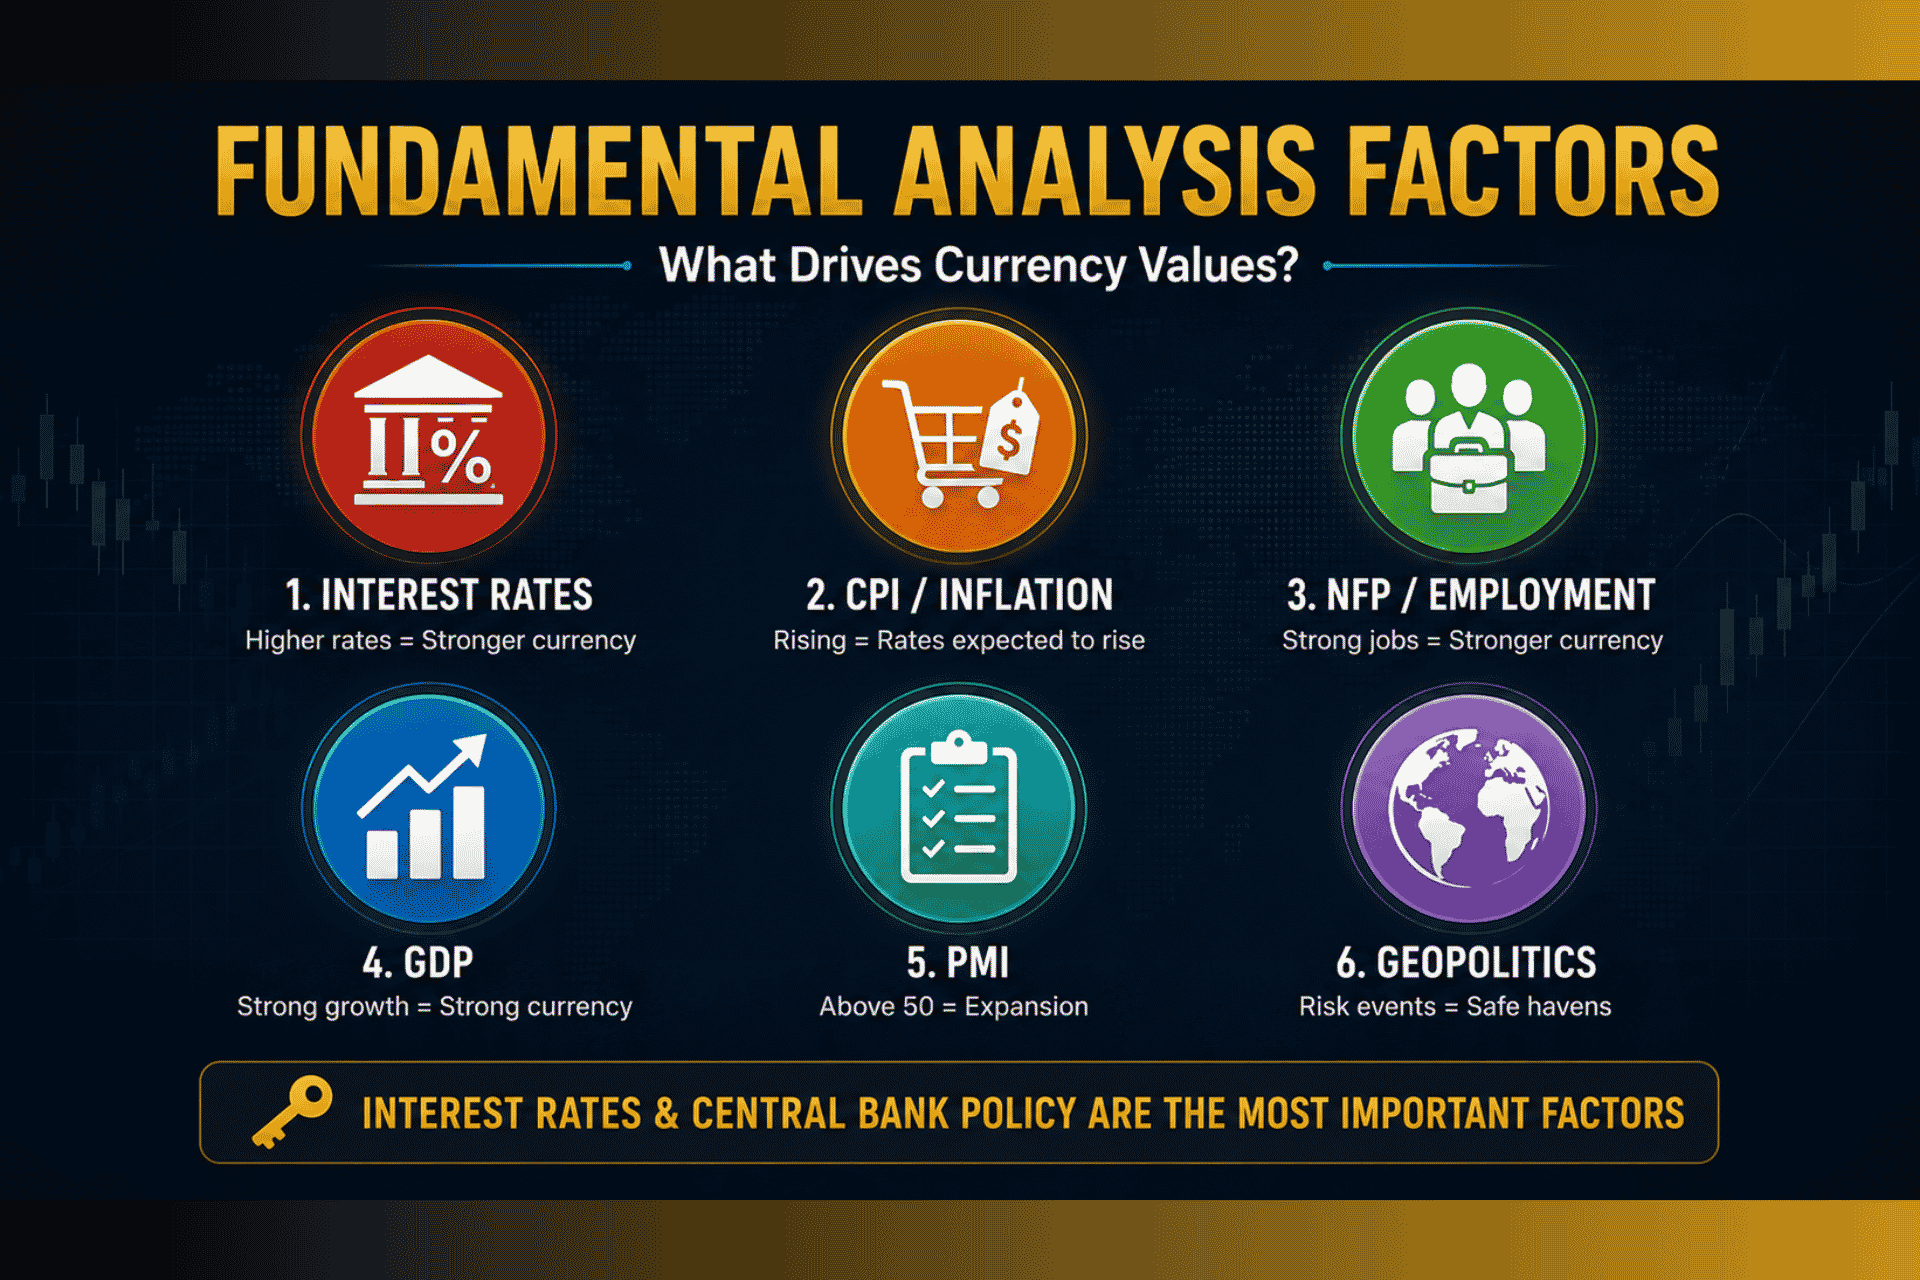
| Factor | What It Measures | Currency Impact |
|---|---|---|
| Interest Rates | Cost of borrowing | Higher rates = stronger currency |
| CPI/Inflation | Price growth | Rising inflation = rates expected to rise |
| NFP/Employment | Labor market health | Strong jobs = stronger currency |
| GDP | Economic growth | Strong growth = stronger currency |
| PMI | Business sentiment | Above 50 = expansion (strengthens currency) |
| Geopolitics | Stability/risk | Risk events = safe-haven flows |
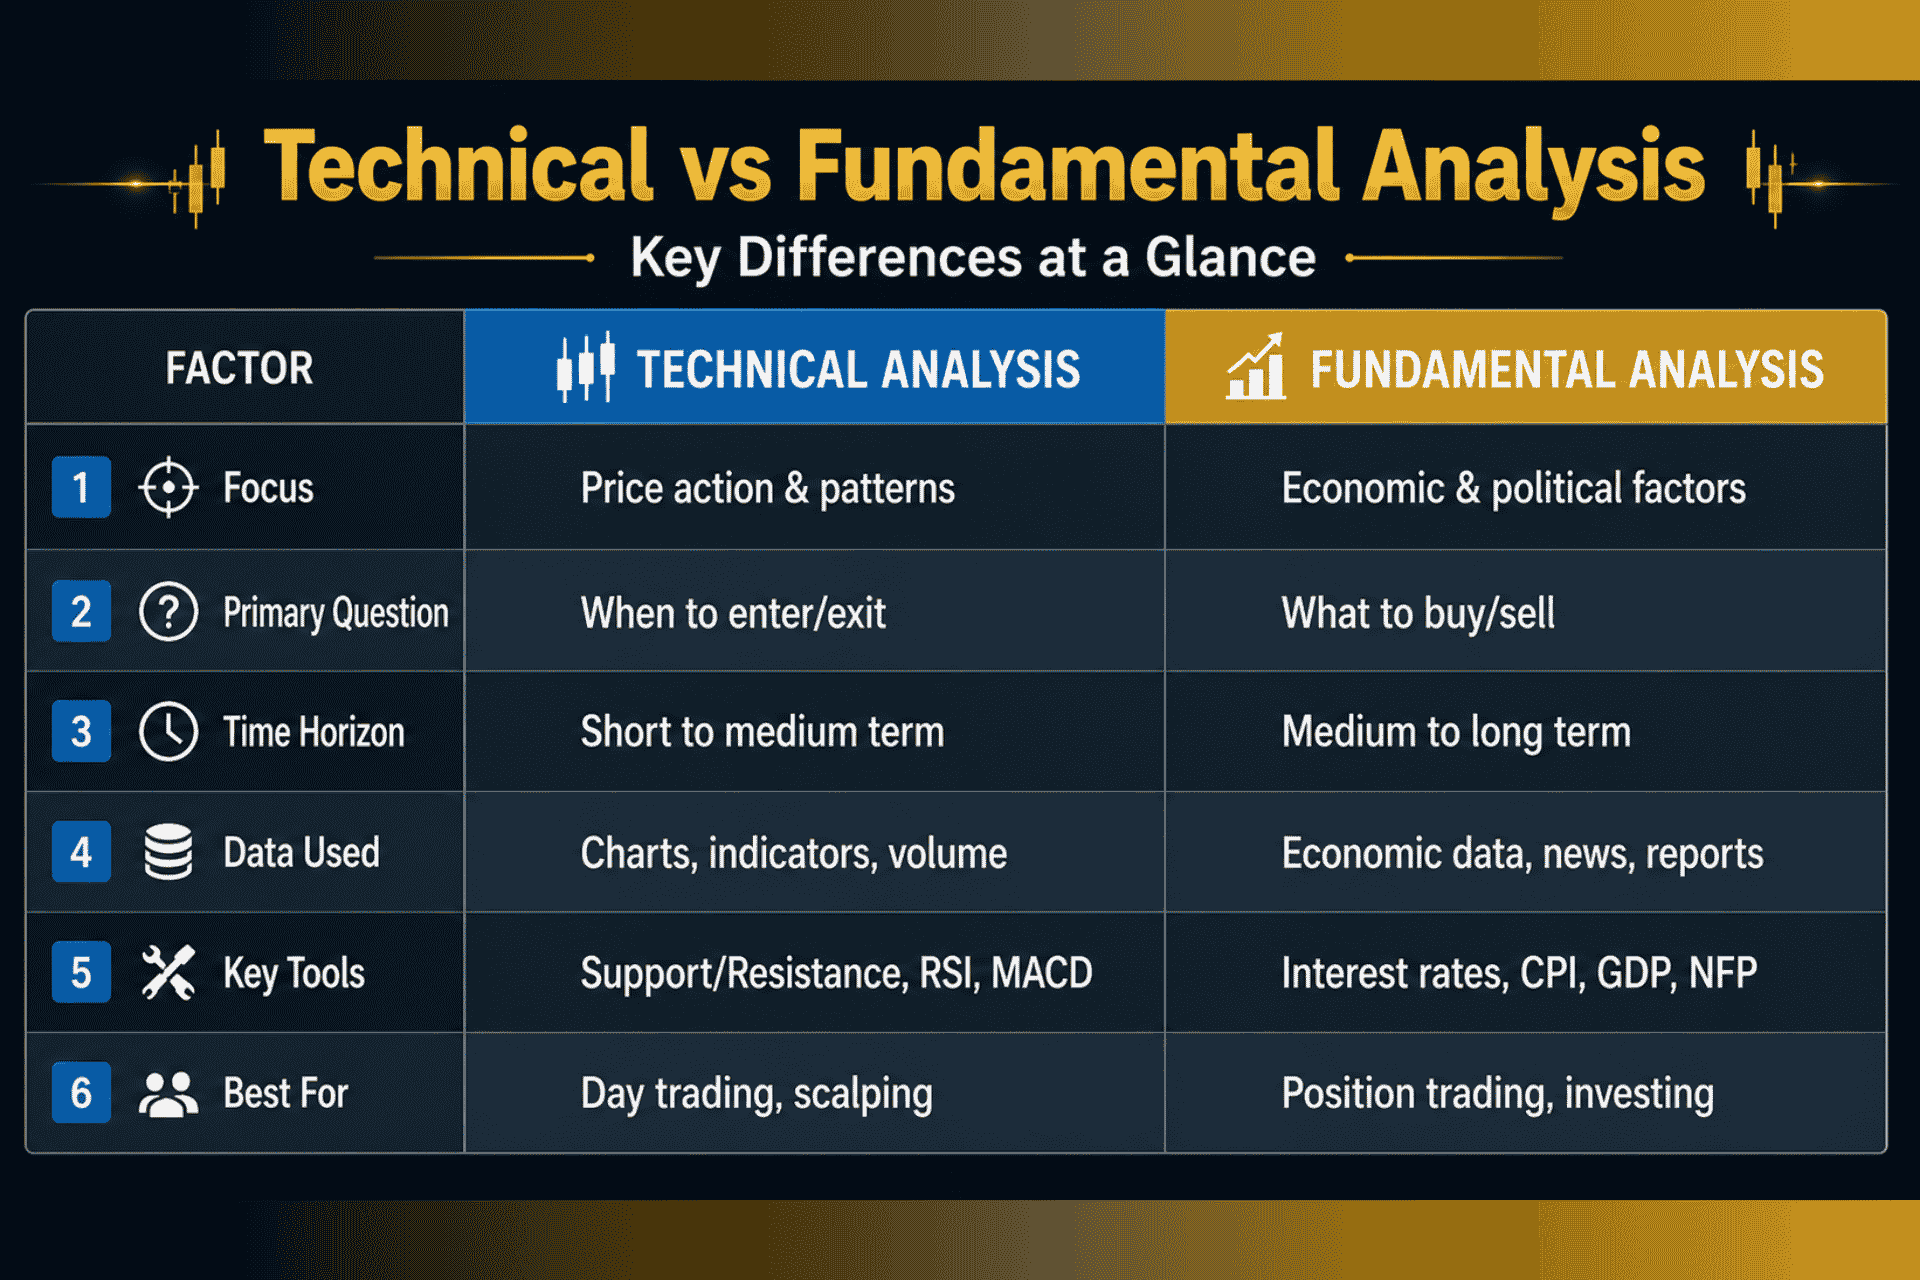
Understanding technical vs fundamental analysis means recognizing their fundamental differences:
| Factor | Technical Analysis | Fundamental Analysis |
|---|---|---|
| Focus | Price action and patterns | Economic and political factors |
| Primary Question | When to enter/exit | What to buy/sell |
| Time Horizon | Short to medium term | Medium to long term |
| Data Used | Charts, indicators, volume | Economic data, news, reports |
| Key Tools | Support/resistance, RSI, MACD, moving averages | Interest rates, CPI, GDP, NFP, central bank policy |
| Approach | Price discounts everything | Price may not reflect true value |
| Decision Making | Pattern recognition | Economic analysis |
| Best For | Day trading, scalping, swing trading | Position trading, long-term investing |
Let’s look at how technical vs fundamental analysis would approach the same trade differently.
Scenario: EUR/USD is trading at 1.1050.
Technical Analysis View:
Technical Decision: Wait for a confirmed breakout above 1.1100, or short with a stop-loss above resistance.
Fundamental Analysis View:
Fundamental Decision: Short EUR/USD in anticipation of a rate cut.
The answer to technical vs fundamental analysis depends on who you are, not just what the market does.
| Scenario | Why Technical Works |
|---|---|
| Short-term trading | Price patterns matter more than long-term fundamentals |
| High volatility | Quick reactions to price changes |
| No news available | Charts provide all the information you need |
| Scalping/Day trading | Requires quick decisions based on price action |
| Scenario | Why Fundamental Works |
|---|---|
| Long-term investing | Economic trends determine long-term currency values |
| Major events | Central bank decisions, elections, trade policies |
| Understanding why | Helps you interpret market moves |
| Position trading | Holding for weeks or months requires fundamental conviction |
| Your Personality | Best Analysis Approach |
|---|---|
| Detail-oriented, patient, enjoys research | Fundamental Analysis |
| Decisive, quick-thinking, loves patterns | Technical Analysis |
| Dislikes complex economics | Technical Analysis |
| Wants to understand “why” | Fundamental Analysis |
| Has limited trading time | Technical Analysis |
| Enjoys following news and data | Fundamental Analysis |
| Likes seeing immediate results | Technical Analysis |
| Thinks long-term | Fundamental Analysis |
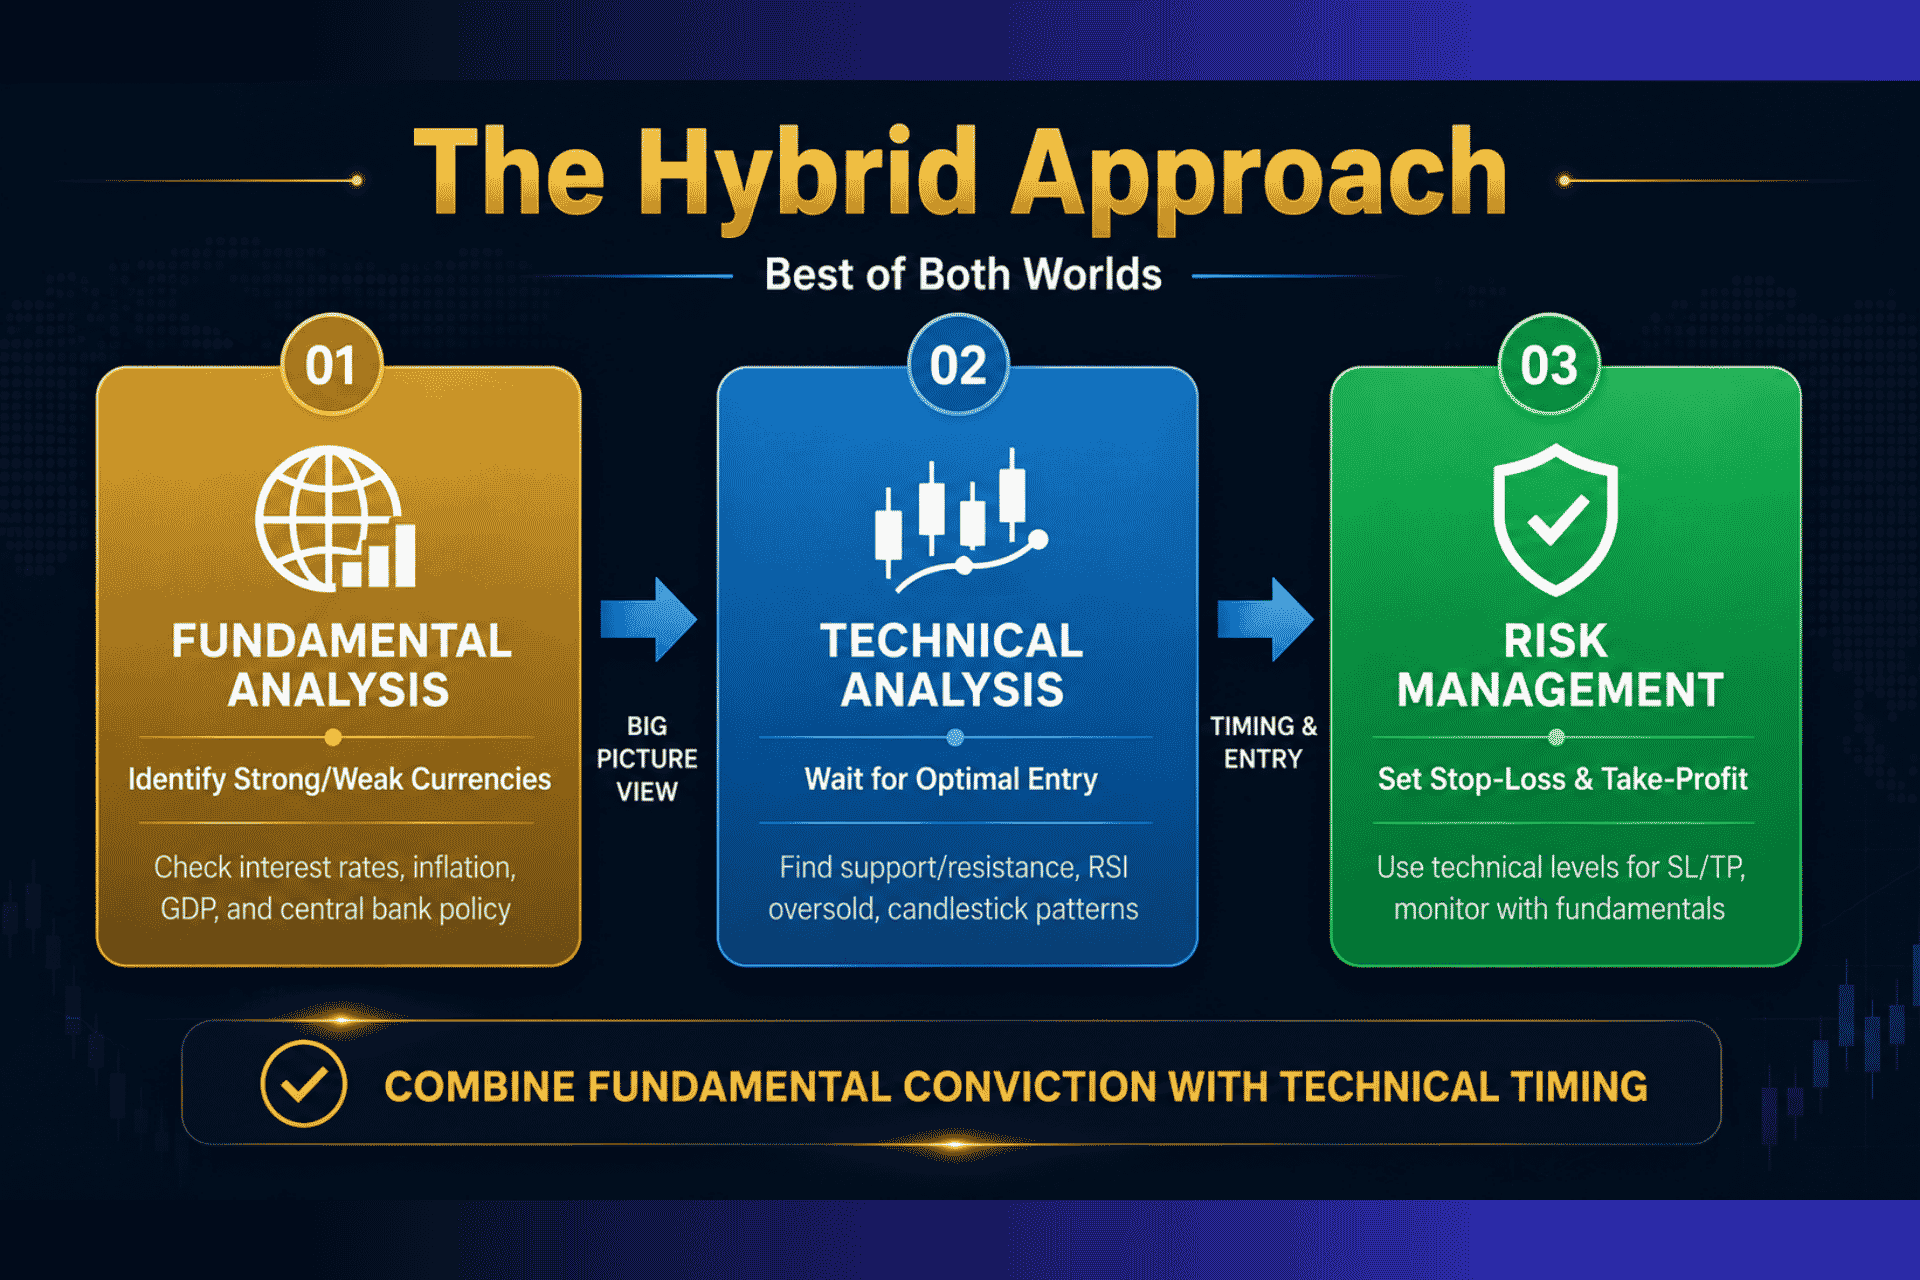
Most successful traders use a hybrid approach, combining technical vs fundamental analysis rather than choosing one.
Scenario: You believe the US Dollar will strengthen based on fundamentals (strong NFP data, hawkish Fed). You want to trade USD/JPY.
Fundamental Step: Confirm the USD is fundamentally strong relative to JPY (BoJ remains dovish). This is your “big picture” view.
Technical Step: Wait for:
Decision: You buy USD/JPY at 145.00 with a stop-loss below support at 144.50. Your fundamental view gives you conviction; your technical tools give you an entry.
| Step | Action | Tool Used |
|---|---|---|
| 1 | Identify strong/weak currencies | Fundamental Analysis |
| 2 | Determine overall trend | Fundamental + Technical |
| 3 | Wait for optimal entry | Technical Analysis |
| 4 | Set stop-loss and take-profit | Technical Analysis (support/resistance) |
| 5 | Monitor trade | Technical Analysis |
| 6 | Exit based on news or target | Fundamental + Technical |
For new traders learning technical vs fundamental analysis, the best answer is:
Reason 1: Technical analysis has a shorter learning curve. You can learn the basics of support/resistance, moving averages, and candlestick patterns in a few weeks.
Reason 2: It gives you immediate feedback. You place a trade, you see the result. This helps you learn faster.
Reason 3: It works for shorter timeframes. Beginners often start with day trading or swing trading, where technical analysis is more relevant.
Reason 1: Understanding economics takes time. It’s not something you master overnight.
Reason 2: Fundamentals matter for position trading. As you hold trades longer, economic factors become more important.
Reason 3: It helps you avoid trading against central banks. Knowing what the Fed, ECB, or BoJ is planning can save you from costly mistakes.
| Mistake | Why It’s a Problem | How to Fix |
|---|---|---|
| Using too many indicators | Analysis paralysis | Stick to 2-3 core indicators |
| Ignoring the big picture | Missing major trends | Check weekly/monthly charts |
| Over-optimizing | Curve fitting | Test strategies on different timeframes |
| Ignoring fundamentals | Trading against central banks | Check the economic calendar |
| Mistake | Why It’s a Problem | How to Fix |
|---|---|---|
| Trading news too aggressively | Market reactions are unpredictable | Wait for confirmation |
| Ignoring technical levels | Poor entries and exits | Use technicals for timing |
| Outdated information | Markets react quickly | Use real-time data |
| Confirmation bias | Only seeing what you want to see | Consider contrary opinions |
| Factor | Technical Analysis | Fundamental Analysis |
|---|---|---|
| Best Timeframe | Short-term (minutes to weeks) | Long-term (weeks to months) |
| Learning Curve | Moderate | Steep |
| Data Availability | Immediate (real-time charts) | Delayed (economic reports) |
| Objectivity | High (clear signals) | Low (subjective interpretation) |
| Market Awareness | Price-focused | Economics-focused |
| Risk Management | Clear (stop-loss levels) | Subjective (economic changes) |
The debate of technical vs fundamental analysis doesn’t have a single winner—and it shouldn’t. Both approaches have strengths and weaknesses.
Technical Analysis is best for:
Fundamental Analysis is best for:
The Hybrid Approach is best for
For Beginners: Start with technical analysis. It’s more accessible and gives immediate feedback. Add fundamental analysis gradually as you gain experience and start holding trades for longer periods.
The key is not to ask “which is better?” but “which is better for me?”
Neither is universally better. Technical analysis excels at timing entries and exits for short-term trades. Fundamental analysis is better for identifying long-term trends and understanding why markets move. The best approach depends on your trading style, time horizon, and personality.
Yes! Most professional traders use a hybrid approach. Use fundamental analysis to identify which currencies are fundamentally strong/weak, then use technical analysis to time your entries and exits with good risk/reward ratios.
Technical analysis typically has a shorter learning curve. You can learn the basics of support, resistance, moving averages, and candlestick patterns relatively quickly. Fundamental analysis requires understanding economics, which takes longer to master.
Yes, technical analysis works well in forex because the forex market is highly liquid and moves in identifiable trends and patterns. Major currency pairs like EUR/USD and GBP/USD have enough volume to make technical levels meaningful.
Interest rates and central bank policy are the most powerful drivers of currency values. Rate differentials between countries determine carry trade flows and long-term currency direction.
The basics can be learned in 2-4 weeks of consistent study. However, mastering technical analysis and developing consistent profitability takes months or years of practice. Start simple, master a few tools, and expand gradually.
Most professionals use a combination of both. Hedge funds, banks, and institutional traders have dedicated analysts for fundamental research and technical traders for execution. The hybrid approach is the industry standard.
To deepen your understanding of forex trading, we recommend exploring these additional resources from Finwirestack:
Disclaimer: Trading forex and CFDs involves significant risk of loss. It is not suitable for all investors. You should carefully consider your investment objectives, level of experience, and risk appetite before trading. Never trade with money you cannot afford to lose. The information provided in this article is for educational purposes only and does not constitute financial advice.