

If you’ve ever watched experienced Forex traders analyze charts, you may have wondered how they seem to identify potential buying and selling opportunities before the market moves.
The answer often lies in technical analysis for Forex beginners—the practice of studying price charts, market trends, and historical price behavior to make more informed trading decisions.
Rather than relying on predictions or emotions, technical analysis focuses on observable market data. Traders use charts, indicators, and recurring price patterns to identify areas where buyers and sellers may influence future price movements.
While no form of analysis can predict markets with certainty, learning Technical Analysis for Forex Beginners provides a structured framework for evaluating trading opportunities and managing risk.
Before reading this guide, make sure you’ve completed these foundational articles on FinWireStack:
Together, these resources provide the foundation you’ll build upon as you learn to read Forex charts with confidence.
What Is Technical Analysis?
Technical Analysis for Forex Beginners is the study of historical price movements using charts, patterns, and mathematical indicators to identify potential trading opportunities.
The underlying principle is straightforward:
Price reflects all publicly available information.
Instead of asking:
“What should this currency pair be worth?”
Technical analysts ask:
“What is the market currently telling us?”
They examine:
- Price action
- Trading trends
- Support levels
- Resistance levels
- Momentum
- Volatility
- Chart patterns
- Technical indicators
By understanding these elements, traders develop a more structured approach to market analysis.
Why Learn Technical Analysis?
Financial markets move because buyers and sellers continuously interact.
Technical analysis helps traders visualize this interaction.
Learning technical analysis for Forex beginners may help you:
- Recognize market trends.
- Identify potential entry points.
- Estimate logical exit points.
- Improve consistency.
- Reduce emotional decision-making.
- Support disciplined Forex risk management.
Technical analysis does not eliminate uncertainty.
Instead, it provides a framework for evaluating probabilities.
Technical Analysis vs. Fundamental Analysis
Many beginners wonder which approach is better.
The answer is that both approaches have strengths.
| Technical Analysis | Fundamental Analysis |
|---|---|
| Studies price charts | Studies economic data |
| Focuses on market behavior | Focuses on economic conditions |
| Uses indicators | Uses financial reports |
| Short- to medium-term trading | Medium- to long-term outlook |
| Entry and exit timing | Broader market direction |
Most experienced traders combine both methods.
For example:
A trader may use fundamental analysis to understand why the U.S. dollar is strengthening while using Technical Analysis for Forex Beginners principles to identify a suitable entry point.
To better understand market drivers, explore educational resources from the International Monetary Fund (IMF): https://www.imf.org
The Three Core Principles of Technical Analysis
Every chart-reading technique is built upon three important ideas.
Principle 1 – The Market Discounts Everything
Technical analysts believe that all publicly available information—including economic reports, geopolitical developments, and investor expectations—is reflected in market prices.
Instead of reacting to every headline, traders focus on how price behaves.
Principle 2 – Prices Move in Trends
Markets rarely move randomly for extended periods.
They generally move in:
- Uptrends
- Downtrends
- Sideways ranges
Recognizing trends is one of the first skills taught in Technical analysis for Forex beginners.
Principle 3 – History Often Rhymes
Financial markets are driven by human behavior.
Fear and greed tend to repeat over time, which is why certain chart patterns appear repeatedly.
Technical analysis does not assume history repeats perfectly.
Instead, it recognizes that similar market conditions often produce similar price behavior.
Some other educational resources include:
- International Monetary Fund (IMF) – https://www.imf.org/
- Bank for International Settlements (BIS) – https://www.bis.org/
- U.S. Commodity Futures Trading Commission (CFTC) – https://www.cftc.gov/LearnAndProtect
- National Futures Association (NFA) – https://www.nfa.futures.org/
The 15 Essential Chart Reading Skills Every Trader Should Learn
Mastering Technical Analysis for Forex Beginners is not about memorizing dozens of indicators. It starts with understanding how to read price charts and interpret what buyers and sellers are doing in real time.
Below are the first five skills every beginner should develop before relying on more advanced technical tools.
Skill #1 – Learn to Read Candlestick Charts
The foundation of Technical Analysis for Forex Beginners is understanding candlestick charts.
Unlike simple line charts, candlesticks provide more information by showing:
- Opening price
- Closing price
- Highest price
- Lowest price
Each candlestick represents the battle between buyers and sellers during a specific time period.
Bullish Candlestick
A bullish candle closes higher than it opens, indicating that buyers were stronger during that period.
Bearish Candlestick
A bearish candle closes lower than it opens, indicating selling pressure.
By studying candlesticks over time, traders begin to recognize shifts in market sentiment.
Why Candlesticks Matter
Candlestick charts help traders:
- Identify momentum.
- Recognize potential reversals.
- Confirm trends.
- Evaluate market sentiment.
Learning to interpret candlesticks is the first practical step in Technical Analysis for Forex Beginners.
Skill #2 – Understand Trading Timeframes
A chart can display the same market in many different timeframes.
Common Forex timeframes include:
| Timeframe | Typical Use |
|---|---|
| 1 Minute | Scalping |
| 5 Minutes | Very short-term trading |
| 15 Minutes | Intraday trading |
| 1 Hour | Swing trading |
| 4 Hours | Position analysis |
| Daily | Trend identification |
| Weekly | Long-term market direction |
One of the most common mistakes beginners make is constantly switching between timeframes without a plan.
Professional traders often analyze:
- Higher timeframe for overall trend.
- Lower timeframe for trade entries.
This “top-down analysis” is a core principle of Technical Analysis for Forex Beginners.
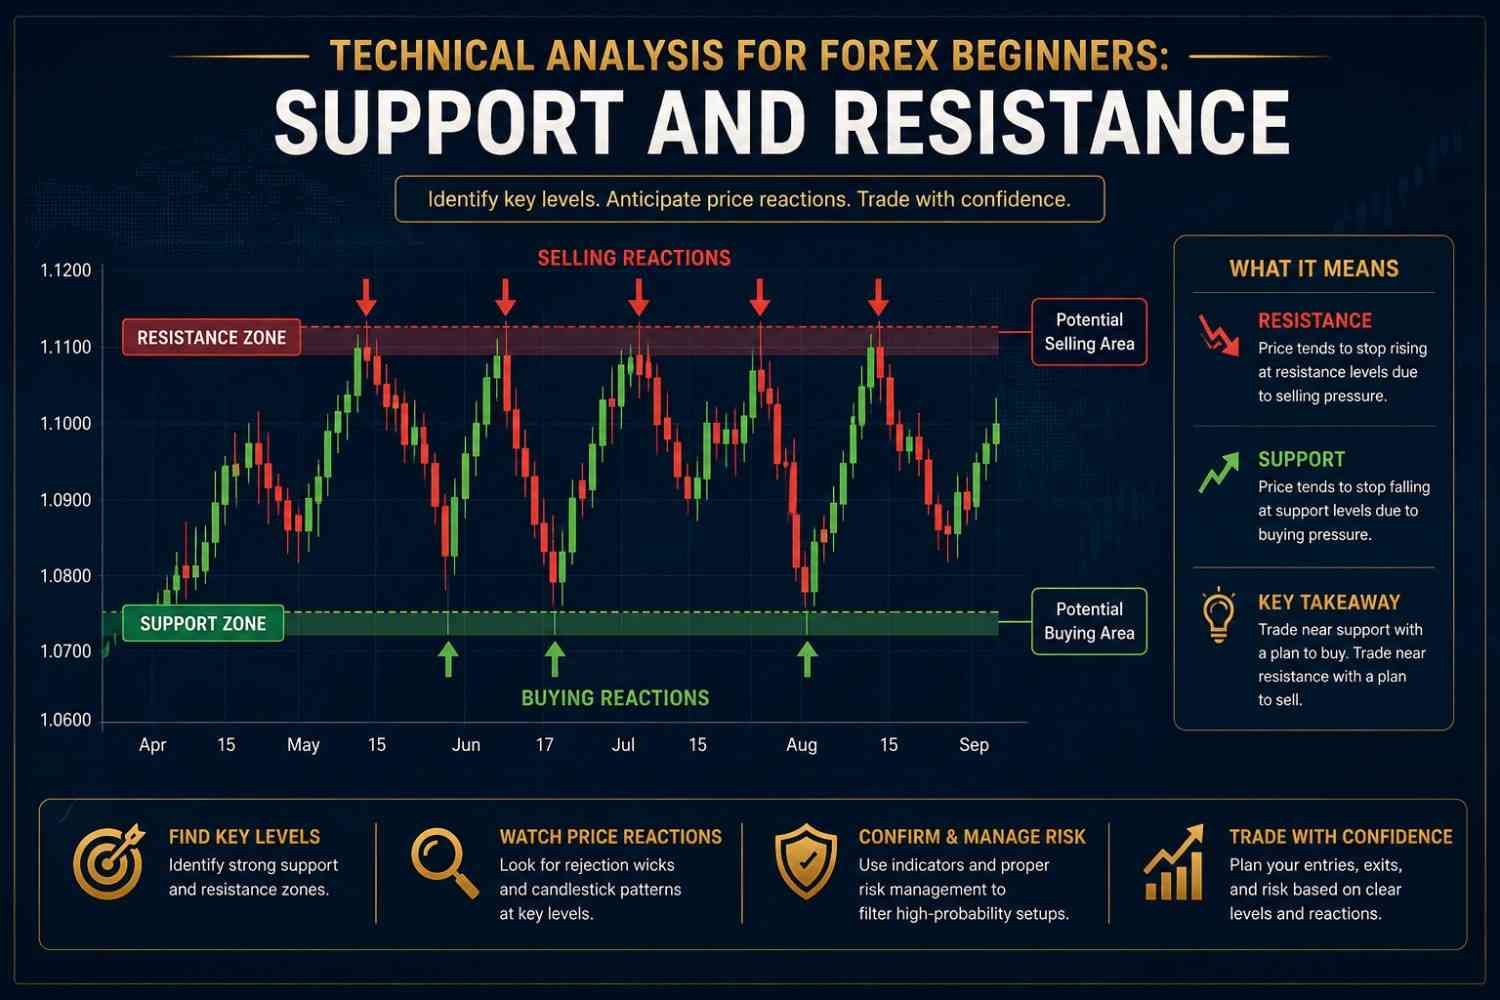
Skill #3 – Identify Support and Resistance
Support and resistance are among the most widely used concepts in Technical Analysis for Forex Beginners.
Support
Support is a price level where buying interest has historically prevented prices from falling further.
Think of it as a floor beneath the price.
Resistance
Resistance is a level where selling pressure has historically limited upward movement.
Think of it as a ceiling above price.
Neither level guarantees a reversal, but they often help traders identify areas where market behavior may change.
Practical Example
Suppose EUR/USD repeatedly declines toward 1.1000 before bouncing higher.
Many traders may begin to view 1.1000 as a support level because buyers have previously entered the market there.
Similarly, if the pair repeatedly struggles to move above 1.1200, that area may become a resistance level.
Support and resistance zones are rarely exact prices; they are often better understood as areas where buying or selling interest has been observed.
Skill #4 – Recognize Market Trends
One of the first questions traders ask is :
“Which direction is the market moving?”
Trend identification is a cornerstone of Technical Analysis for Forex Beginners.
Markets generally move in one of three directions:
Uptrend
An uptrend is characterized by:
- Higher highs.
- Higher lows.
This suggests buyers are generally in control.
Downtrend
A downtrend consists of:
- Lower highs.
- Lower lows.
This indicates sustained selling pressure.
Sideways Market
Sometimes prices move within a range without a clear upward or downward trend.
During these periods, many traders wait for stronger directional signals before entering new positions.
Learning to distinguish between these market environments helps traders select strategies that align with prevailing conditions.
Skill #5 – Draw Trend Lines Correctly
Trend lines help visualize market direction.
A trend line connects multiple significant highs or lows to illustrate the prevailing trend.
Uptrend Line
Draw beneath successive higher lows.
Downtrend Line
Draw above successive lower highs.
Trend lines are guides rather than exact barriers.
Price may briefly move beyond a trend line before continuing in the original direction.
For this reason, traders often combine trend lines with:
- Support and resistance.
- Candlestick analysis.
- Momentum indicators.
This layered approach strengthens Technical Analysis for Forex Beginners by reducing reliance on a single tool.
Common Beginner Mistakes (Part 1)
Avoid these common errors while learning Technical Analysis for Forex Beginners:
❌ Using too many indicators on one chart.
❌ Changing timeframes constantly.
❌ Assuming every support level will hold.
❌ Drawing trend lines through insignificant price points.
❌ Ignoring the broader market trend.
Keeping charts clean and focusing on core concepts often produces better learning outcomes than adding unnecessary complexity.
Some of Other Informative topics within this page include:
These articles provide the broader context that supports effective technical analysis.
Skill #6 – Recognize High-Probability Chart Patterns
Chart patterns are recurring formations that develop as buyers and sellers interact in the market. While they do not guarantee future price movements, they can provide useful context when combined with sound Technical Analysis for Forex Beginners principles.
Some of the most commonly observed patterns include:
Head and Shoulders
Often associated with a potential trend reversal after an uptrend.
Characteristics:
- Left shoulder
- Higher head
- Right shoulder
- Neckline support
A break below the neckline may suggest weakening buying momentum.
Double Top
A bearish reversal pattern.
Price tests a resistance level twice but struggles to move higher.
Double Bottom
A bullish reversal pattern.
Price tests a support level twice before showing renewed buying interest.
Ascending Triangle
Often considered a bullish continuation pattern.
Characteristics:
- Rising support line
- Flat resistance
A breakout above resistance may indicate increasing buying pressure.
Descending Triangle
Often viewed as a bearish continuation pattern.
Characteristics:
- Falling resistance
- Horizontal support
A break below support may suggest increasing selling pressure.
Symmetrical Triangle
A consolidation pattern where both buyers and sellers temporarily lose momentum.
The eventual breakout direction is not predetermined, so traders often wait for confirmation before entering a position.
Learning these formations is an important milestone in Technical Analysis for Forex Beginners, but remember that patterns work best when supported by other analytical tools.
Skill #7 – Use Moving Averages to Identify Trends
Moving averages are among the most widely used technical indicators.
They smooth short-term price fluctuations and help traders visualize the underlying trend.
The two most common types are:
Simple Moving Average (SMA)
Calculates the average closing price over a specific number of periods.
Examples:
- 20 SMA
- 50 SMA
- 200 SMA
Exponential Moving Average (EMA)
Places greater emphasis on recent prices, making it more responsive to current market movements.
Many traders prefer EMAs for shorter-term analysis because they react more quickly to changing conditions.
Common Uses
Moving averages may help traders:
- Identify trend direction.
- Locate dynamic support and resistance.
- Confirm trend strength.
- Reduce market noise.
For beginners learning Technical Analysis for Forex Beginners, moving averages should be viewed as tools that support analysis rather than standalone trading signals.

Skill #8 – Understand the Relative Strength Index (RSI)
The Relative Strength Index (RSI) is a momentum indicator that measures the speed and magnitude of recent price movements.
It typically ranges from 0 to 100.
Many traders watch two key zones:
Above 70
May indicate that buying momentum has become unusually strong.
Some traders interpret this as a sign that the market could become overextended, although strong trends can remain above 70 for extended periods.
Below 30
May indicate that selling momentum has become unusually strong.
Some traders view this as a potential area to monitor for signs of stabilization or reversal.
Importantly, RSI should not be used in isolation. Within Technical Analysis for Forex Beginners, it is more effective when combined with trend analysis, support and resistance, or chart patterns.
Skill #9 – Learn How MACD Measures Momentum
The Moving Average Convergence Divergence (MACD) is another popular momentum indicator.
It helps traders evaluate:
- Trend direction.
- Momentum strength.
- Potential changes in market momentum.
The MACD consists of:
- MACD Line
- Signal Line
- Histogram
When the MACD line crosses above the signal line, some traders interpret this as strengthening bullish momentum.
When it crosses below, some traders view it as increasing bearish momentum.
As with any indicator, MACD should complement—not replace—broader Technical Analysis for Forex Beginners.
Skill #10 – Understand Volume and Volatility
Unlike stock markets, the decentralized nature of Forex means there is no single global measure of trading volume.
However, many trading platforms provide tick volume, which measures the number of price changes during a given period.
While not identical to actual traded volume, it can still offer useful context.
Volatility refers to how much prices move over time.
Higher volatility may create more trading opportunities but can also increase risk.
Lower volatility often results in smaller price movements and fewer trading opportunities.
Understanding volatility is especially important because it influences:
- Stop-loss placement.
- Position sizing.
- Risk-to-reward ratios.
This reinforces why Technical Analysis for Forex Beginners should always be paired with sound Forex Risk Management principles.
Combining Multiple Signals
One of the most valuable lessons in Technical Analysis for Forex Beginners is that experienced traders rarely rely on a single indicator.
Instead, they look for confluence, where several independent signals support the same trading idea.
For example:
- Price approaches a long-term support zone.
- RSI moves below 30 and begins to recover.
- A bullish candlestick pattern forms.
- The overall trend remains positive on the daily timeframe.
While none of these factors guarantees a successful trade, together they may provide a stronger analytical framework than any single signal alone.
Practical Example
Imagine EUR/USD has been trending higher for several weeks.
As price approaches a previously established support area:
- The 50-day moving average is rising.
- RSI has fallen from overbought levels toward the middle of its range.
- A bullish engulfing candlestick appears.
- MACD momentum begins improving.
A trader applying Technical Analysis for Forex Beginners would evaluate these signals collectively, confirm that the setup aligns with their trading plan, and then decide whether the potential reward justifies the risk.
Common Beginner Mistakes (Part 2)
Avoid these common pitfalls:
❌ Treating every chart pattern as a guaranteed signal.
❌ Entering trades solely because RSI reaches 70 or 30.
❌ Using too many indicators that provide similar information.
❌ Ignoring overall market context.
❌ Confusing correlation with confirmation.
Successful Technical Analysis for Forex Beginners emphasizes patience, confirmation, and disciplined execution rather than chasing every market movement.
Understanding these topics alongside technical analysis creates a more balanced trading education.
Skill #11 – Use Fibonacci Retracement Wisely
Fibonacci Retracement is one of the most popular tools in Technical Analysis for Forex Beginners because it helps traders identify areas where price may pause or reverse during an existing trend.
The most commonly watched retracement levels are:
- 23.6%
- 38.2%
- 50.0%
- 61.8%
- 78.6%
These percentages are plotted between a significant swing high and swing low.
Example
Suppose EUR/USD rises from 1.0800 to 1.1200 before pulling back.
A trader may draw Fibonacci Retracement levels to identify potential support areas where buyers could return.
However, Fibonacci levels should never be treated as guaranteed reversal points. Instead, they become more valuable when they align with:
- Support and resistance zones
- Trend lines
- Moving averages
- Bullish or bearish candlestick patterns
This combination strengthens Technical Analysis for Forex Beginners by encouraging confirmation rather than prediction.
Skill #12 – Identify Breakouts and False Breakouts
Markets frequently spend time consolidating before making larger directional moves.
A breakout occurs when price moves decisively beyond an established support or resistance level.
Common breakout areas include:
- Trend lines
- Horizontal resistance
- Horizontal support
- Chart patterns
- Trading ranges
False Breakouts
Not every breakout succeeds.
Sometimes price briefly moves beyond a level before quickly reversing.
These are known as false breakouts or fakeouts.
Professional traders often wait for:
- A candle close beyond the level.
- Increased momentum.
- Confirmation from additional indicators.
Patience is an important lesson in Technical Analysis for Forex Beginners.

Skill #13 – Practice Multiple Timeframe Analysis
Professional traders rarely rely on a single chart timeframe.
Instead, they compare multiple timeframes to gain broader market context.
A common workflow is:
| Timeframe | Purpose |
|---|---|
| Daily | Identify long-term trend |
| 4-Hour | Analyze market structure |
| 1-Hour | Locate trade setup |
| 15-Minute | Fine-tune entry timing |
This approach helps traders avoid taking trades that conflict with the broader trend.
For example:
A bullish signal on a 15-minute chart may carry less weight if the daily chart is in a strong downtrend.
Multiple timeframe analysis is an important skill within Technical Analysis for Forex Beginners because it encourages traders to evaluate the bigger picture before making decisions.
Skill #14 – Keep a Technical Trading Journal
One of the fastest ways to improve is by documenting your trades.
A trading journal helps identify:
- Repeated mistakes.
- Successful setups.
- Emotional decision-making.
- Risk management issues.
- Areas for improvement.
Your journal might include:
- Screenshot of the chart.
- Entry price.
- Exit price.
- Stop-loss level.
- Take-profit level.
- Reason for entering.
- Result.
- Lessons learned.
Reviewing previous trades helps transform experience into measurable improvement.
Skill #15 – Build a Complete Technical Analysis Routine
Rather than randomly opening charts and looking for trades, develop a repeatable process.
A simple routine could include:
Step 1
Review today’s economic calendar.
Step 2
Identify the overall trend.
Step 3
Draw support and resistance.
Step 4
Check moving averages.
Step 5
Review RSI and MACD.
Step 6
Look for chart patterns.
Step 7
Calculate risk.
Step 8
Only enter trades that satisfy your written plan.
Following the same process every day helps improve consistency and reinforces disciplined Technical Analysis for Forex Beginners.
Putting Everything Together
Imagine GBP/USD is approaching a major support level.
You observe:
- Daily trend remains bullish.
- Price reaches long-term support.
- RSI moves below 30 before recovering.
- MACD begins turning upward.
- A bullish engulfing candlestick forms.
- Price remains above the 200-day moving average.
Rather than acting on a single signal, you evaluate all the evidence together.
This process of combining multiple forms of analysis is often referred to as confluence, and it is one of the most valuable concepts in Technical Analysis for Forex Beginners.
Common Beginner Mistakes (Part 3)
Avoid these habits:
❌ Drawing Fibonacci levels from insignificant highs and lows.
❌ Trading every breakout immediately without confirmation.
❌ Ignoring higher timeframe trends.
❌ Skipping trade reviews.
❌ Constantly changing trading strategies after a few losses.
Long-term improvement comes from refining a consistent process rather than searching for a “perfect” indicator.
For further learning, consider these trusted educational sources:
- Bank for International Settlements (BIS) – https://www.bis.org/
- Commodity Futures Trading Commission (CFTC) – https://www.cftc.gov/LearnAndProtect
- National Futures Association (NFA) – https://www.nfa.futures.org/
- International Monetary Fund (IMF) – https://www.imf.org/
These organizations provide reliable information about global financial markets, market structure, and responsible trading practices.
Technical Analysis Myths vs Facts
Many beginners develop unrealistic expectations about technical analysis. Understanding the difference between myths and reality will help you build a more disciplined trading mindset.
| Myth | Fact |
|---|---|
| Technical analysis predicts the future. | Technical Analysis for Forex Beginners identifies probabilities, not certainties. |
| One indicator is enough to make profitable trades. | Professional traders combine multiple forms of confirmation before making decisions. |
| More indicators produce better results. | Too many indicators often create conflicting signals and unnecessary complexity. |
| Every chart pattern leads to a breakout. | Chart patterns improve analysis but never guarantee future price movement. |
| Technical analysis only works for experienced traders. | Beginners can learn technical analysis by mastering the fundamentals step by step. |
| Losing trades mean the analysis failed. | Even excellent analysis results in losing trades. The goal is consistency over many trades. |
Understanding these principles reinforces why Technical Analysis for Forex Beginners should always be paired with sound Forex Risk Management.
Technical Analysis Checklist
Before entering any trade, ask yourself the following questions.
Market Structure
☐ Have I identified the overall trend?
☐ Am I trading with or against the higher timeframe?
☐ Have I marked important support and resistance zones?
Chart Analysis
☐ Is there a recognizable chart pattern?
☐ Have I confirmed the setup using candlesticks?
☐ Do moving averages support the trend?
☐ Does RSI support my analysis?
☐ Does MACD confirm momentum?
Risk Assessment
☐ Is my stop-loss logically placed?
☐ Does the trade meet my minimum risk-to-reward ratio?
☐ Have I calculated my position size?
☐ Am I following my trading plan?
Psychology
☐ Am I trading based on analysis rather than emotion?
☐ Am I avoiding FOMO?
☐ Have I accepted the possibility of a losing trade?
This checklist complements Technical Analysis for Forex Beginners by encouraging consistency and discipline before every trade.

Frequently Asked Questions (FAQ)
What is Technical Analysis for Forex Beginners?
Technical Analysis for Forex Beginners is the study of historical price charts, market trends, chart patterns, and technical indicators to help traders identify potential trading opportunities and improve decision-making.
Is technical analysis better than fundamental analysis?
Neither approach is universally better. Many experienced traders combine Technical Analysis for Forex Beginners with fundamental analysis to understand both market direction and trade timing.
Which chart type is best for beginners?
Candlestick charts are the most widely used because they clearly display the opening, closing, high, and low prices while helping traders recognize market sentiment.
What indicators should beginners learn first?
Many beginners start with:
- Moving Averages
- RSI (Relative Strength Index)
- MACD
These indicators are relatively straightforward and can complement broader technical analysis.
Can technical analysis guarantee profitable trades?
No.
Technical Analysis for Forex Beginners helps evaluate probabilities, not certainties. Every trade carries risk, which is why technical analysis should always be combined with sound risk management.
How long does it take to learn technical analysis?
Learning the basics may take weeks or months, but becoming consistently disciplined requires continuous study, practice, and trade review. Developing a trading journal and following a structured plan can accelerate improvement.
Key Takeaways
As you continue your trading journey, remember these essential lessons:
- Learn to read candlestick charts before relying on complex indicators.
- Identify trends before looking for entries.
- Use support and resistance as areas of interest, not exact prices.
- Combine multiple technical signals rather than relying on one indicator.
- Wait for confirmation before entering trades.
- Use technical analysis alongside proper risk management.
- Keep a detailed trading journal and review your progress regularly.
- Continue learning as markets evolve.
These habits form the foundation of effective Technical Analysis for Forex Beginners.
Final Thoughts
Learning Technical Analysis for Forex Beginners is not about predicting every market movement—it is about making informed decisions based on evidence, discipline, and probability.
Successful traders understand that no indicator, chart pattern, or strategy works all the time. Instead, they focus on developing a repeatable process that combines technical analysis, sound Forex Risk Management, and continuous education.
Technical analysis is a skill that improves through practice. The more charts you study, the more patterns you observe, and the more consistently you review your trades, the stronger your analytical abilities will become.
At FinWireStack, our goal is to help readers develop practical, evidence-based trading knowledge that supports long-term growth and responsible participation in financial markets.
Continue Your Learning Journey
Build your Forex knowledge with these related guides on FinWireStack:
- Complete Beginner’s Guide to Forex Trading
- Forex vs Crypto Trading: 15 Essential Differences Every Beginner Must Know
- How to Choose a Forex Broker
- Forex Risk Management: 17 Proven Strategies to Protect Your Trading Capital
- Trading Psychology: How Emotions Affect Trading Decisions (upcoming)
- AI Tools Every Forex Trader Should Know (upcoming)
These articles are designed to help you progress from beginner to confident trader through structured, practical education.
Trusted External Resources
For additional learning, consult these authoritative organizations:
- Bank for International Settlements (BIS) – https://www.bis.org/
- International Monetary Fund (IMF) – https://www.imf.org/
- Commodity Futures Trading Commission (CFTC) – https://www.cftc.gov/LearnAndProtect
- National Futures Association (NFA) – https://www.nfa.futures.org/
- Federal Reserve – https://www.federalreserve.gov/
- OECD – https://www.oecd.org/
These resources provide valuable information on market structure, economic developments, financial regulation, and investor education.