
How to read forex charts is one of the first skills every aspiring trader must master. Without this ability, you are essentially trading blind—relying on intuition rather than data and emotion rather than analysis.
But here is the good news: learning how to read forex charts is not as complicated as it seems. Once you understand the basic building blocks—candlesticks, timeframes, support and resistance, and a few key patterns—you will be able to look at any chart and quickly assess what the market is telling you.
This comprehensive guide will teach you how to read forex charts from the ground up. You will learn:
- The different types of forex charts and when to use each
- How to read candlestick charts like a professional
- How to identify trends, support, and resistance
- Five essential candlestick patterns every beginner must know
- How to apply these skills with real-world examples
- A practical chart-reading checklist for every trade
By the end, you will have the confidence to look at any forex chart and understand the story it is telling.
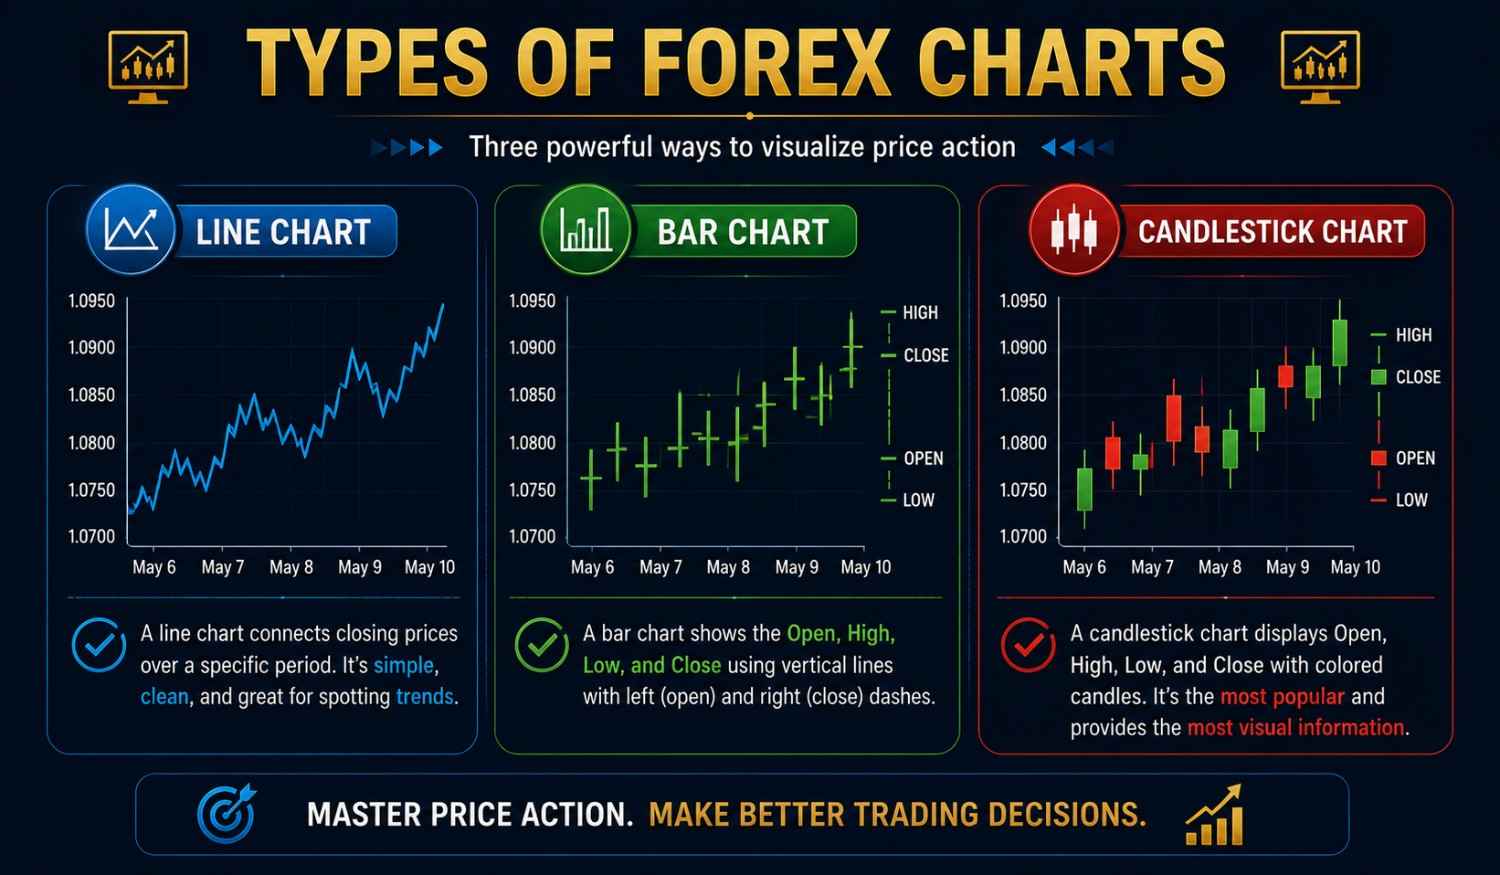
The three main types of forex charts are line, bar, and candlestick
What is a Forex Chart?
A forex chart is a visual representation of the price movements of a currency pair over a specific period of time. It shows how the exchange rate has changed, allowing traders to analyze trends, identify patterns, and make informed decisions about when to buy or sell.
Any chart will always display two things on its axes:
- Time is on the horizontal x-axis
- Price is on the vertical y-axis
In this way, a chart shows how a market’s price has changed over time. You can choose how much time to show on your chart—from one minute to one month or even one year.
The 5 Main Types of Forex Charts
When learning how to read forex charts, you will encounter several different chart types. Each offers a different level of detail and serves a different purpose.
1. Line Charts (Mountain Charts)
A line chart connects a set of single exchange rate observations with a straight line. These charts most often use closing prices, although they could be drawn through high, low, or opening prices instead.
When to Use: Line charts offer a simplified picture of exchange rate movements, making them excellent for identifying overall trends and large-scale patterns. They help you de-noise the chart and see the primary drift quickly.
🎯 Real-World Example: If you want to see whether EUR/USD has been generally rising or falling over the past six months, a line chart gives you that answer in three seconds. You don’t need the noise of every intraday fluctuation.
2. Bar Charts (OHLC or HLOC Charts)
Bar charts show the high, low, open, and close (OHLC) for each time period. Each bar is formed by:
- A vertical line connecting the high and low
- A small horizontal dash protruding to the left shows the open price
- A small horizontal dash protruding to the right shows the close price
When to Use: Bar charts provide more information than line charts while maintaining a clean appearance. They are particularly useful for identifying exchange rate gaps and seeing whether the market has closed above a key level.
3. Candlestick Charts
Candlestick charts are a Japanese invention that offers even more information than a bar chart because the color of the candle’s body immediately tells you whether the market rose or fell during the period. This is the most popular chart type for traders learning how to read forex charts.
Anatomy of a Candlestick:
- Body: The rectangular area between the open and close prices
- Upper Wick: The line from the top of the body to the highest price
- Lower Wick: The line from the bottom of the body to the lowest price
- Color: Green (or white) for bullish candles (close > open), red (or black) for bearish candles (close < open)
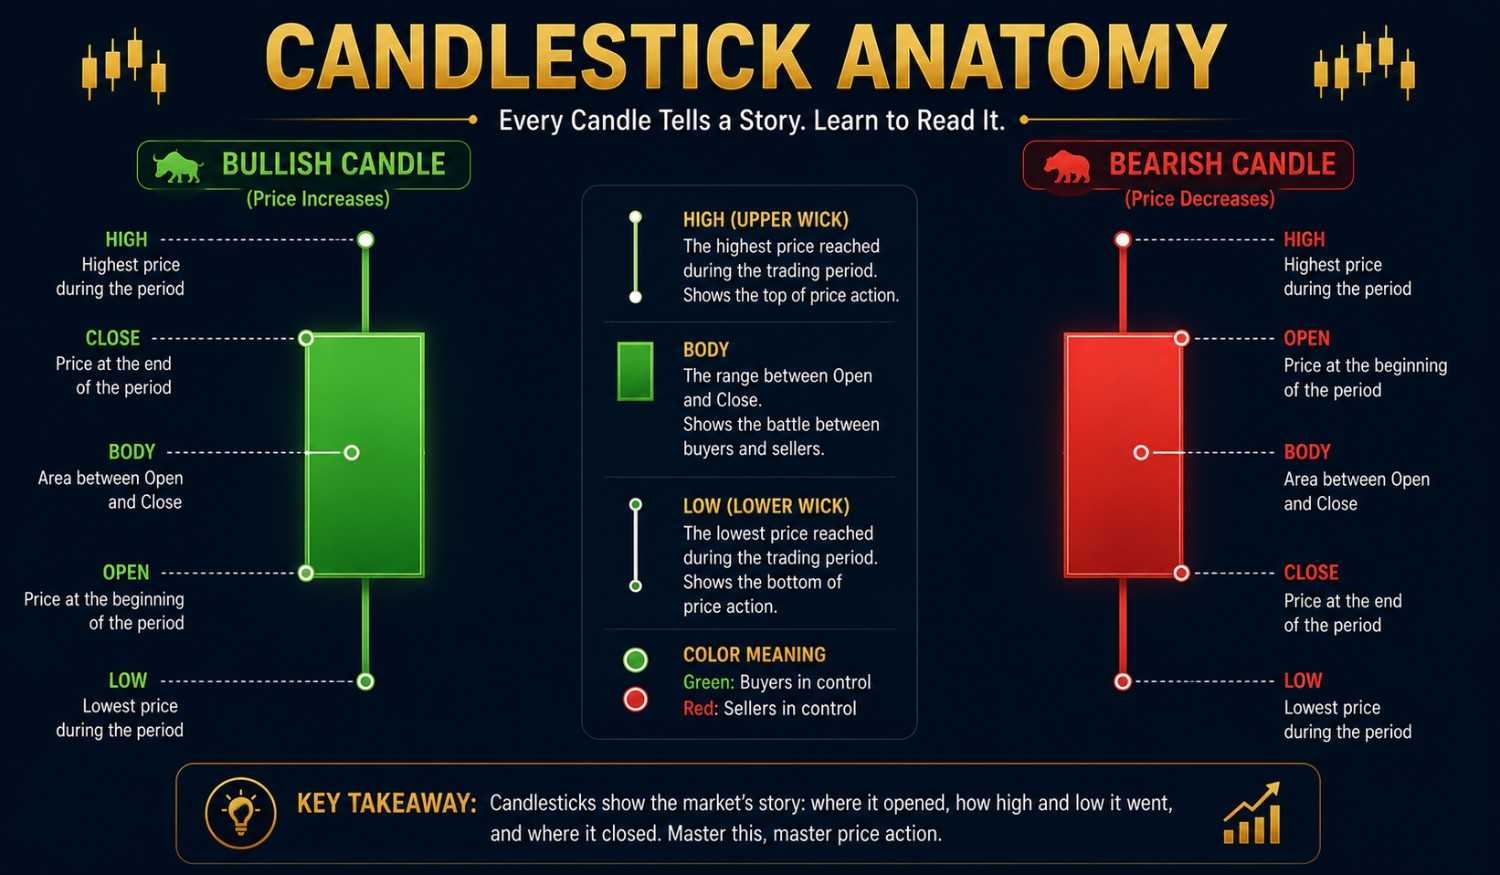
The anatomy of a candlestick—understanding open, high, low, and close when learning how to read forex charts.
How to Read a Candlestick
Understanding how to read forex charts means understanding what each candlestick tells you. A single candlestick reveals four critical pieces of information:
| Element | What It Tells You |
|---|---|
| Open | The price at the start of the period |
| High | The highest price reached during the period |
| Low | The lowest price reached during the period |
| Close | The price at the end of the period |
| Color | Whether buyers (green) or sellers (red) controlled the period |
What Different Candlesticks Mean
| Candle Type | What It Looks Like | What It Tells You |
|---|---|---|
| Long Green Body | Tall green rectangle | Strong buying pressure—buyers were in control throughout the period |
| Long Red Body | Tall red rectangle | Strong selling pressure—sellers were in control |
| Small Body (Green or Red) | Short rectangle | Indecision—neither buyers nor sellers dominated |
| Long Upper Wick | Long line above small body | The price rallied but was pushed back down—sellers stepped in |
| Long Lower Wick | Long line below small body | The price fell but was pushed back up—buyers stepped in |
| Doji | Open ≈ Close (cross shape) | Complete indecision—the market is undecided |
Understanding Timeframes
Timeframes are a crucial part of how to read forex charts. The timeframe determines how often a new candle or bar is printed on your chart.
Common Timeframes
| Timeframe | Type | Best Used For |
|---|---|---|
| M1, M5, M15 | Short-term | Day trading, scalping |
| H1, H4 | Medium-term | Swing trading, beginner-friendly |
| Daily, Weekly | Long-term | Position trading, identifying major trends |
| Monthly | Very Long-term | Understanding multi-year trends |
The Top-Down Approach
Professional traders use a top-down approach when analyzing charts:
- Map trends and key levels on the Daily or Weekly chart (the “big picture”)
- Refine your analysis on the H4 or H1 chart (the “medium picture”)
- Execute your trade on the H1 or M15 chart (the “entry” picture)
🎯 Real-World Example: You want to trade EUR/USD.
- Weekly Chart: You see EUR/USD is in a strong uptrend (higher highs and higher lows)
- H4 Chart: You see price is pulling back to a support level near 1.1000
- H1 Chart: You spot a bullish candlestick pattern confirming the support hold
- Entry: You buy EUR/USD at 1.1005 with a stop-loss below the recent swing low
Using multiple timeframes to identify trends and find the best entry points when learning how to read forex charts
Support and Resistance: The Foundation of Chart Reading
Support and resistance are the foundation of technical analysis. They are so important that even traders who focus on fundamentals use them for entry and exit points.
What Are Support and Resistance?
| Level | Definition | Analogy |
|---|---|---|
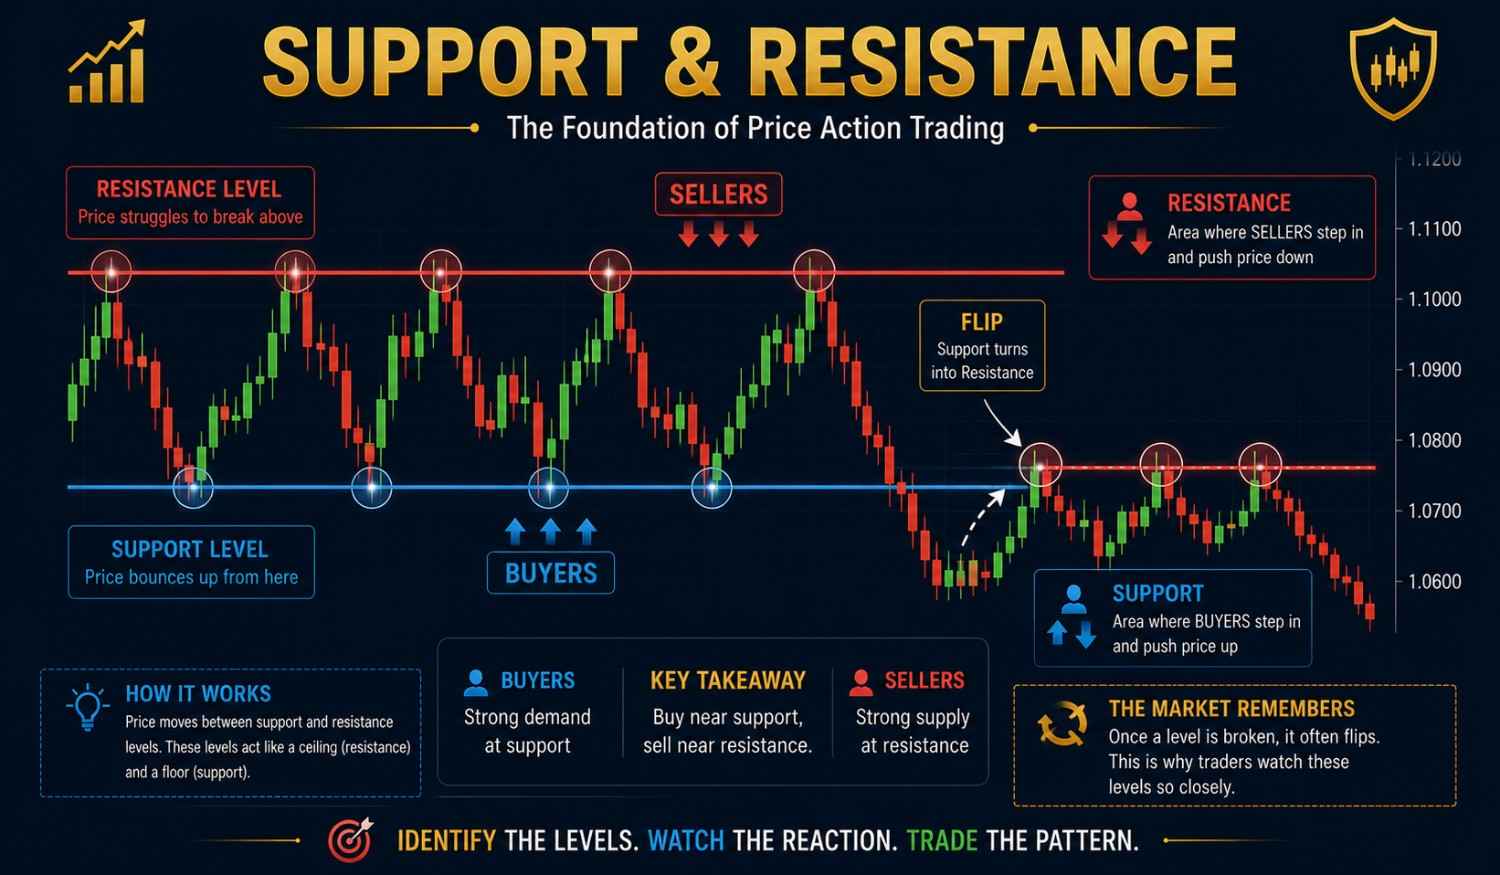
| Support | A price level where buying pressure is strong enough to prevent further declines | A “floor” that prices bounce off |
| Resistance | A price level where selling pressure is strong enough to prevent further rises | A “ceiling” that prices bounce off |
When learning how to read forex charts, support and resistance levels reflect past market behavior, influencing future price action based on trader psychology. At support levels, previous buying interest suggests a potential buying opportunity. Conversely, resistance levels might trigger selling from traders who recall prior struggles for the price to break through.
How to Identify Support and Resistance
| Method | How It Works | Example |
|---|---|---|
| Swing Highs/Lows | Look for obvious peaks and troughs | A swing high at 1.1100 becomes resistance |
| Round Numbers | Prices ending in .00 or .50 | 1.1000 is a psychological level |
| Prior Levels | Levels that worked in the past often work again | Support at 1.1000 that held three times |
| Moving Averages | Dynamic support/resistance. The The | 200-day MA often acts as support |
The “Flip” Phenomenon
A critical concept in how to read forex charts is that support and resistance can flip roles. Once a support level is breached, it very often delivers resistance, and vice versa.
🎯 Real-World Example:
- Step 1: Price finds support at 1.1000 three times (support level established)
- Step 2: Price breaks BELOW 1.1000 (support is breached)
- Step 3: Price rallies back UP to 1.1000 (retesting the level)
- Step 4: 1.1000 now acts as RESISTANCE (the level has flipped)
This flip phenomenon occurs because traders who bought near support now want to break even, creating selling pressure. This is a powerful concept in how to read forex charts.
Round Numbers: Psychological Levels
Trading psychology plays a huge factor in trading and can be viewed on the charts. Round numbers—price levels ending in .00 or .50—are particularly important because traders are attracted to them.
🎯 Real-World Example: If EUR/USD is approaching 1.1000, traders will place:
- Sell limit orders at 1.1000 (expecting resistance)
- Buy stop orders above 1.1000 (expecting a breakout)
- Protective stop-loss orders just beyond the level
Result: A collection of orders tends to congregate around these price points, making them highly significant. However, whipsaws around psychological levels are common, so think of them as zones, not exact laser lines, when learning how to read forex charts.
Support and resistance—the foundation of technical analysis
5 Candlestick Patterns Every Beginner Must Know
An entire technical analysis science has evolved regarding specific combinations of candlesticks that have predictive value. Here are the five most important patterns for beginners learning how to read forex charts.
1. Engulfing Pattern (Bullish and Bearish)
What It Looks Like: A two-candle pattern where the second candle’s body completely covers (engulfs) the first candle’s body.
Bullish Engulfing (Reversal from Downtrend to Uptrend):
- First candle: Small bearish (red)
- Second candle: Large bullish (green) that engulfs the first
- Psychology: Buyers have overpowered sellers; momentum is shifting
Bearish Engulfing (Reversal from Uptrend to Downtrend):
- First candle: Small bullish (green)
- Second candle: Large bearish (red) that engulfs the first
- Psychology: Sellers have overpowered buyers; momentum is shifting down
🎯 Real-World Example: Suppose EUR/USD has been falling steadily for weeks. In one session, it posts a small red candle, followed by a large green candle that engulfs it. The next day, the price gaps higher with strong volume, confirming the bullish reversal. This is a classic entry signal when learning how to read forex charts.
2. Doji
What It Looks Like: A candle where the opening and closing prices are equal (or very close), creating a cross shape.
Psychology: Complete indecision in the market. Neither buyers nor sellers could assert enough influence to move the price significantly.
When It Matters: A doji forming within an uptrend or downtrend may indicate a reversal is on the way.
🎯 Real-World Example: EUR/USD has been in a strong uptrend for two weeks. Suddenly, a doji forms. This suggests buyers are losing momentum. If the next candle is bearish, it confirms a potential reversal to the downside.
3. Hammer (Bullish Reversal)
What It Looks Like: A candle with a long lower wick and a small body near the top of the candle.
Psychology: Sellers pushed the price down during the period, but buyers stepped in aggressively and pushed the price back up. The long lower wick shows buyers’ strength.
When It Matters: At the bottom of a downtrend, a hammer signals a potential bullish reversal.
🎯 Real-World Example: EUR/USD has been falling for several days. A hammer forms with a long lower wick and a small green body near the top. This indicates buyers have stepped in. You could enter a long position with a stop-loss below the hammer’s low as explained when learning how to read forex charts.
4. Shooting Star (Bearish Reversal)
What It Looks Like: A candle with a long upper wick and a small body near the bottom of the candle.
Psychology: Buyers pushed the price up during the period, but sellers stepped in aggressively and pushed the price back down. The long upper wick shows sellers’ strength.
When It Matters: At the top of an uptrend, a shooting star signals a potential bearish reversal.
5. Inside Bar
What It Looks Like: A small candle that is completely within the range of the previous candle (the “mother bar”).
Psychology: Consolidation and indecision. The market is coiling up for a potential breakout.
When It Matters: After a strong trend, an inside bar can signal a continuation or a reversal. Trade the break in the direction of the overall trend context.
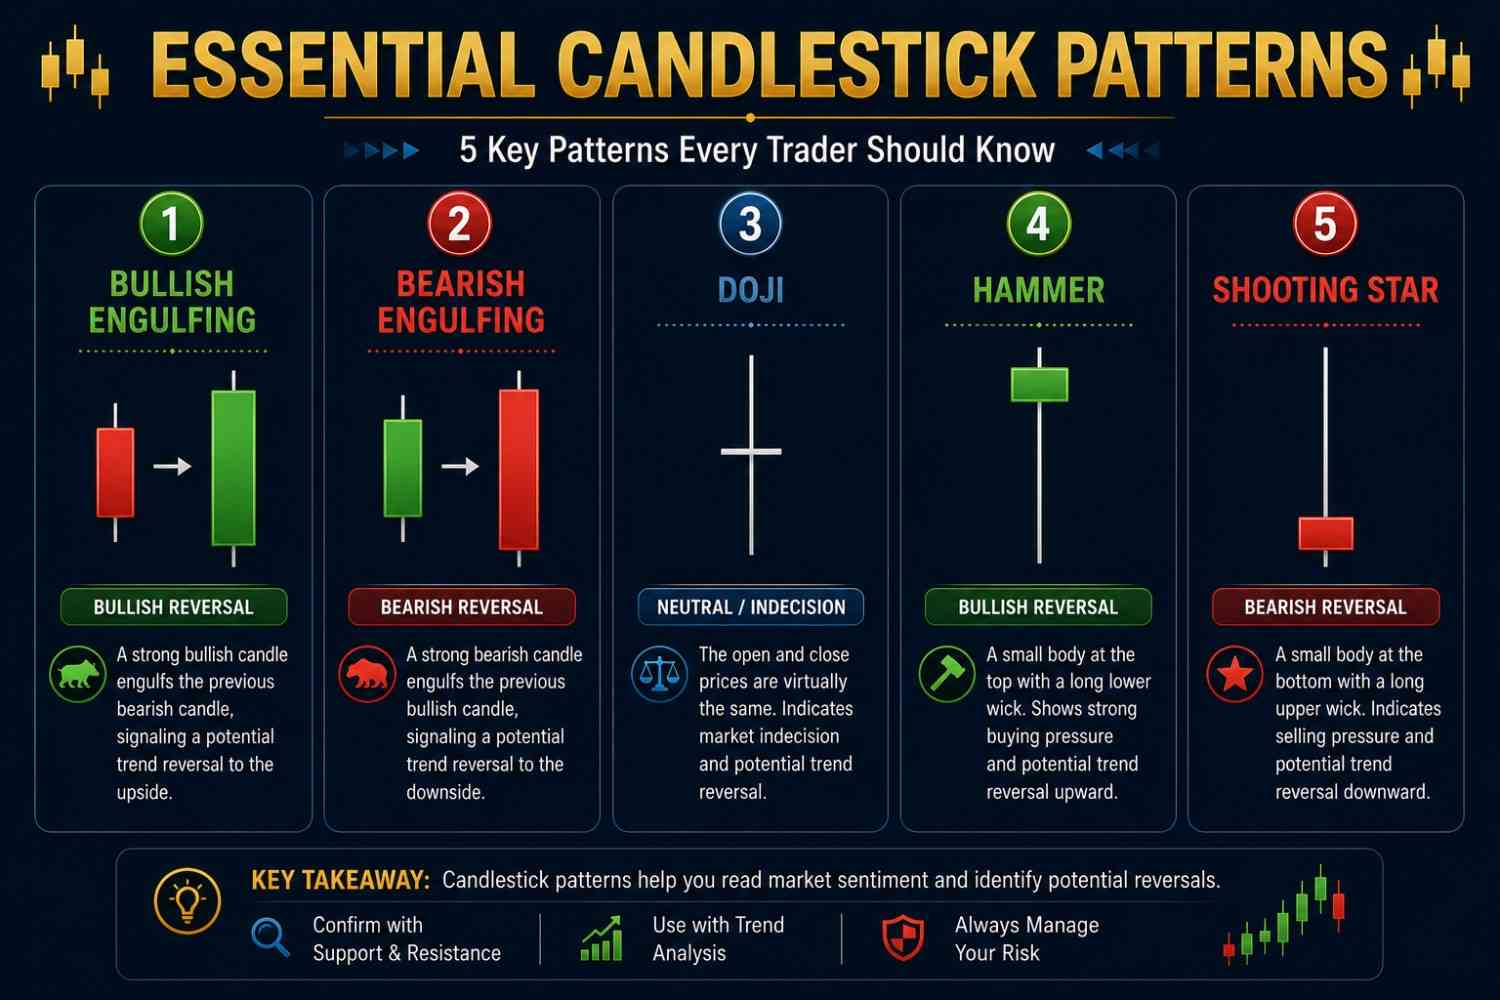
Five essential candlestick patterns every beginner must know
Practical Example: How to Read a Forex Chart Step-by-Step
Let’s walk through a real-world example of how to read forex charts using the EUR/USD 15-minute chart.
Context
You are watching EUR/USD on a 15-minute chart. You want to find a trading opportunity.
Step 1: Identify the Trend
- You look at the H4 chart first (top-down analysis)
- The H4 chart shows that EUR/USD is in an uptrend (higher highs and higher lows)
- The 20-period EMA is above the 50-period EMA, confirming bullish momentum
Step 2: Mark Support and Resistance
- You mark a key resistance level at 1.0900 (price has been rejected here twice)
- You mark a key support level at 1.0850 (price has bounced here three times)
Step 3: Watch for a Breakout
- Price breaks above 1.0900 with a strong bullish candle
- This is a breakout of resistance—a potential entry signal
Step 4: Wait for the Retest
- Instead of buying immediately, you wait for the price to retest 1.0900 from above
- The retest happens—the price comes back down to 1.0900 and then bounces up
- A bullish rejection candle forms at the retest level
Step 5: Execute the Trade
- Entry: Buy at 1.0902 (after bullish rejection candle confirms)
- Stop-Loss: 8 pips below the rejection low at 1.0894
- Take-Profit: 12 pips above at 1.0914 (1.5R target)
Step 6: Position Sizing
- Account: $1,000
- Risk per trade: 1% = $10
- Stop distance: 8 pips
- Required pip value: $10 ÷ 8 = $1.25 per pip
- On EUR/USD, 1.00 lot ≈ $10 per pip, so 0.125 lots ≈ $1.25 per pip
Result: This is how you translate a written risk rule into a real lot size before you hit the button.
Your Chart-Reading Checklist
Before you click buy or sell, use this checklist to ensure you have properly analyzed the chart:
- Use Candlesticks for analysis—they give you the most information
- Flip to a Line Chart to verify—check the overall slope/trend
- Pick H1 or H4 to start—less noise than M1 or M5
- Mark Support/Resistance from higher timeframes—refine on lower timeframes
- Add one indicator (EMA or RSI) for confirmation—No clutter
- Define entry, stop-loss, and take-profit in writing
- Journal the trade idea—including why you didn’t take marginal setups
Common Mistakes When Learning How to Read Forex Charts
| Mistake | Why It’s a Problem | How to Fix |
|---|---|---|
| Using too many indicators | Analysis paralysis | Stick to 2-3 tools |
| Worshipping single candles | Out of context, a candle is meaningless | Always consider the trend and key levels |
| Entering before the candle closes | Half-formed candles lie | Wait for confirmation |
| Hiding stops inside obvious wikis. | Gets stopped out by market noise | Place stops beyond clear levels |
| Ignoring the higher timeframe | Missing the big picture | Always start with the weekly/daily chart |
| Chasing breakouts | Often too late | Wait for the retest of the broken level |
Conclusion: Your Chart-Reading Journey Starts Here
Learning how to read forex charts is the foundation of successful trading. It transforms you from a gambler into an analyst, from someone who hopes the market moves in their favor to someone who understands why it moves.
Key Takeaways:
- Candlestick charts are your best tool—they show you open, high, low, and close prices in an easy-to-read format
- Support and resistance are the foundation—They tell you where buyers and sellers are likely to step in
- Always start with the higher timeframe—The weekly and daily charts show the big picture
- Learn five key patterns—Engulfing, Doji, Hammer, Shooting Star, Inside Bar
- Never trade a pattern without context—A hammer in the middle of nowhere is just a funny stick
- Journal every trade—Write down why you entered and why you exited
- Practice on a demo account—Before risking real money, practice your chart reading on a demo account
🎯 Final Thought: The charts are not just lines and candles—they are a visual representation of human psychology, fear, and greed. By learning how to read forex charts, you are learning how to read the market’s emotional state. Master this skill, and you will trade with confidence, discipline, and clarity.
FAQ
1. What is the best chart type for beginners?
Candlestick charts are the best choice for beginners. They show the most information (open, high, low, and close) in an easy-to-read, easy-to-understand format, especially when focusing on how to read forex charts.
2. How do I identify a trend on a chart?
An uptrend is characterized by higher highs and higher lows. A downtrend is characterized by lower highs and lower lows. A ranging market moves sideways between support and resistance.
3. What is the most reliable candlestick pattern?
The engulfing pattern is considered highly reliable because it shows a clear shift in momentum from buyers to sellers (or vice versa). However, always consider the context—patterns are more reliable at key support/resistance levels.
4. How long should I practice reading charts?
Stay on a demo account until you can consistently identify trends, support/resistance, and key patterns without hesitation. Most experts recommend 30-60 days of practice before trading with real money after mastering how to read forex charts.
5. Should I use indicators?
Indicators should confirm what your eyes see, not replace them. Start with just one or two—like a 20-period and 50-period EMA—and add more only when you understand how to read raw price action.
6. What is the difference between a support and a resistance level?
Support is a “floor” where buyers typically step in. Resistance is a “ceiling” where sellers typically step in. Both are critical for setting entry, stop-loss, and take-profit levels, making it an important lesson on how to read forex charts.
Further Reading
To deepen your understanding of forex trading, we recommend exploring these additional resources from Finwirestack:
- 7 Proven Steps to Start Trading Forex: Beginner’s Guide — Learn how to choose a broker, open an account, and place your first trade after learning how to read forex charts.
- Essential Forex Trading Terminology: Ultimate Guide — Master the language of forex with 100+ terms explained with real examples on how to read forex charts.
- Technical vs Fundamental Analysis: Which Strategy Wins? — Discover which trading approach suits your personality, especially when learning how to read forex charts.
- Risk Management Mastery: 7 Proven Strategies—Master position sizing, stop-loss strategies, and trading psychology, making “how to read forex charts” easy
External Resources (DoFollow Links)
- Investopedia: Candlestick Patterns — Comprehensive guide to candlestick patterns on how to read forex charts.
- BabyPips: How to Read Forex Charts—Beginner-friendly chart reading education on how to read forex charts.
- DailyFX: Technical Analysis — Daily technical analysis articles and market insights on how to read forex charts.
- TradingView: Chart Analysis Tools — Free charting platform for practicing chart reading on how to read forex charts.
Disclaimer: Trading forex and CFDs involves significant risk of loss. It is not suitable for all investors. You should carefully consider your investment objectives, level of experience, and risk appetite before trading. Never trade with money you cannot afford to lose. The information provided in this article is for educational purposes only and does not constitute financial advice.






[…] How to Read Forex Charts: 5 Powerful Patterns for Beginners — Learn to spot key patterns and understand price action in relation to how to trade forex news. […]
[…] How to Read Forex Charts: 5 Powerful Patterns for Beginners — Learn to spot key patterns and understand price action, focusing on advanced Forex strategies. […]
[…] psychologyFinWireStack’s Forex chart-reading guide can also help beginners build the technical foundation needed before relying heavily on […]
[…] a rapid drawdown when market conditions change.If you are considering Forex copy trading, understanding how to read Forex charts can still be valuable even when someone else makes the trading decisions. How to Read Forex Charts: […]
[…] Professional charts […]